User:Jake Mulroy/Notebook/Biology 210 at AU
1/26/2016
Abiotic Factors
Five wooden benches, Two metal signs, A drainage system, A stone path, A tiny pond, A bird feeder, Animal tracks, Snow, Roper building, Trash cans, Artificial light, Rocks
Biotic Factors
Oak tree, Persian Parrotia, Bushes, Shrubs, Organisms living in water, Organisms living in dirt, Leaves, Grass, Squirrels, Birds, Human interaction
General Description
When walking towards transect four, it is obvious to realize that the area is a designated green-space for Roper Hall. The area is flanked by Roper Hall on one side and by trees and shrubs on the other. There is a stone path that was placed in the middle of the transect in order to make it easily walkable. Five worn wooden benches flank the wooden path in order to give people a place to sit and admire the green-space. Towards the far left of the transect lies a tiny pond that is fenced off. The pond has a small marble statue and sign that states “Certified Wildlife Habitat.” During the day, animal tracks can be seen as well as squirrels and birds who use the large oak tree as shelter. The ground crunches under your feet due to the fallen leaves and winter crust. Small pieces of grass dot the ground as do rocks and leaves. The shrubs and bushes create a barrier around the transect in order to shelter the wildlife found within. After the snow had fallen, the area became extremely quiet. The snow remained untouched and the area was shunned by humans. Only the sound of melting snow and squirrels scurrying up the oak tree could be heard and seen. J.M.
1/26/2016
Hay Infusion Lab
Purpose: The purpose of this lab was to be able to use a dichotomous key to identify unknown protists in our hay infusion. Another purpose was to identify the characteristics of algae and protists. Finally, we were to identify and record the algae and protists within our transect.
Materials and Methods: The first thing to do in this lab was to take a sample from the hay infusion and look at it under a microscope. Using the dichotomous key, the algae and protist present were to be identified and drawn. Samples from different niches within the hay infusion had to be tested it order to see which kind of life they contained.
Figure 1 is the surface niche at 10x magnification. It shows paramecium that range in size from 10um to 100um. Figure 2 also shows the paramecium in the surface niche but this time the paramecium are sized 200um.
Figure 3 is also the surface niche at 10x magnification but this shows a vorticella organism sized 30um. Figure 4 is the bottom niche at 10x magnification but this just showed paramecium of sizes 50-100um.
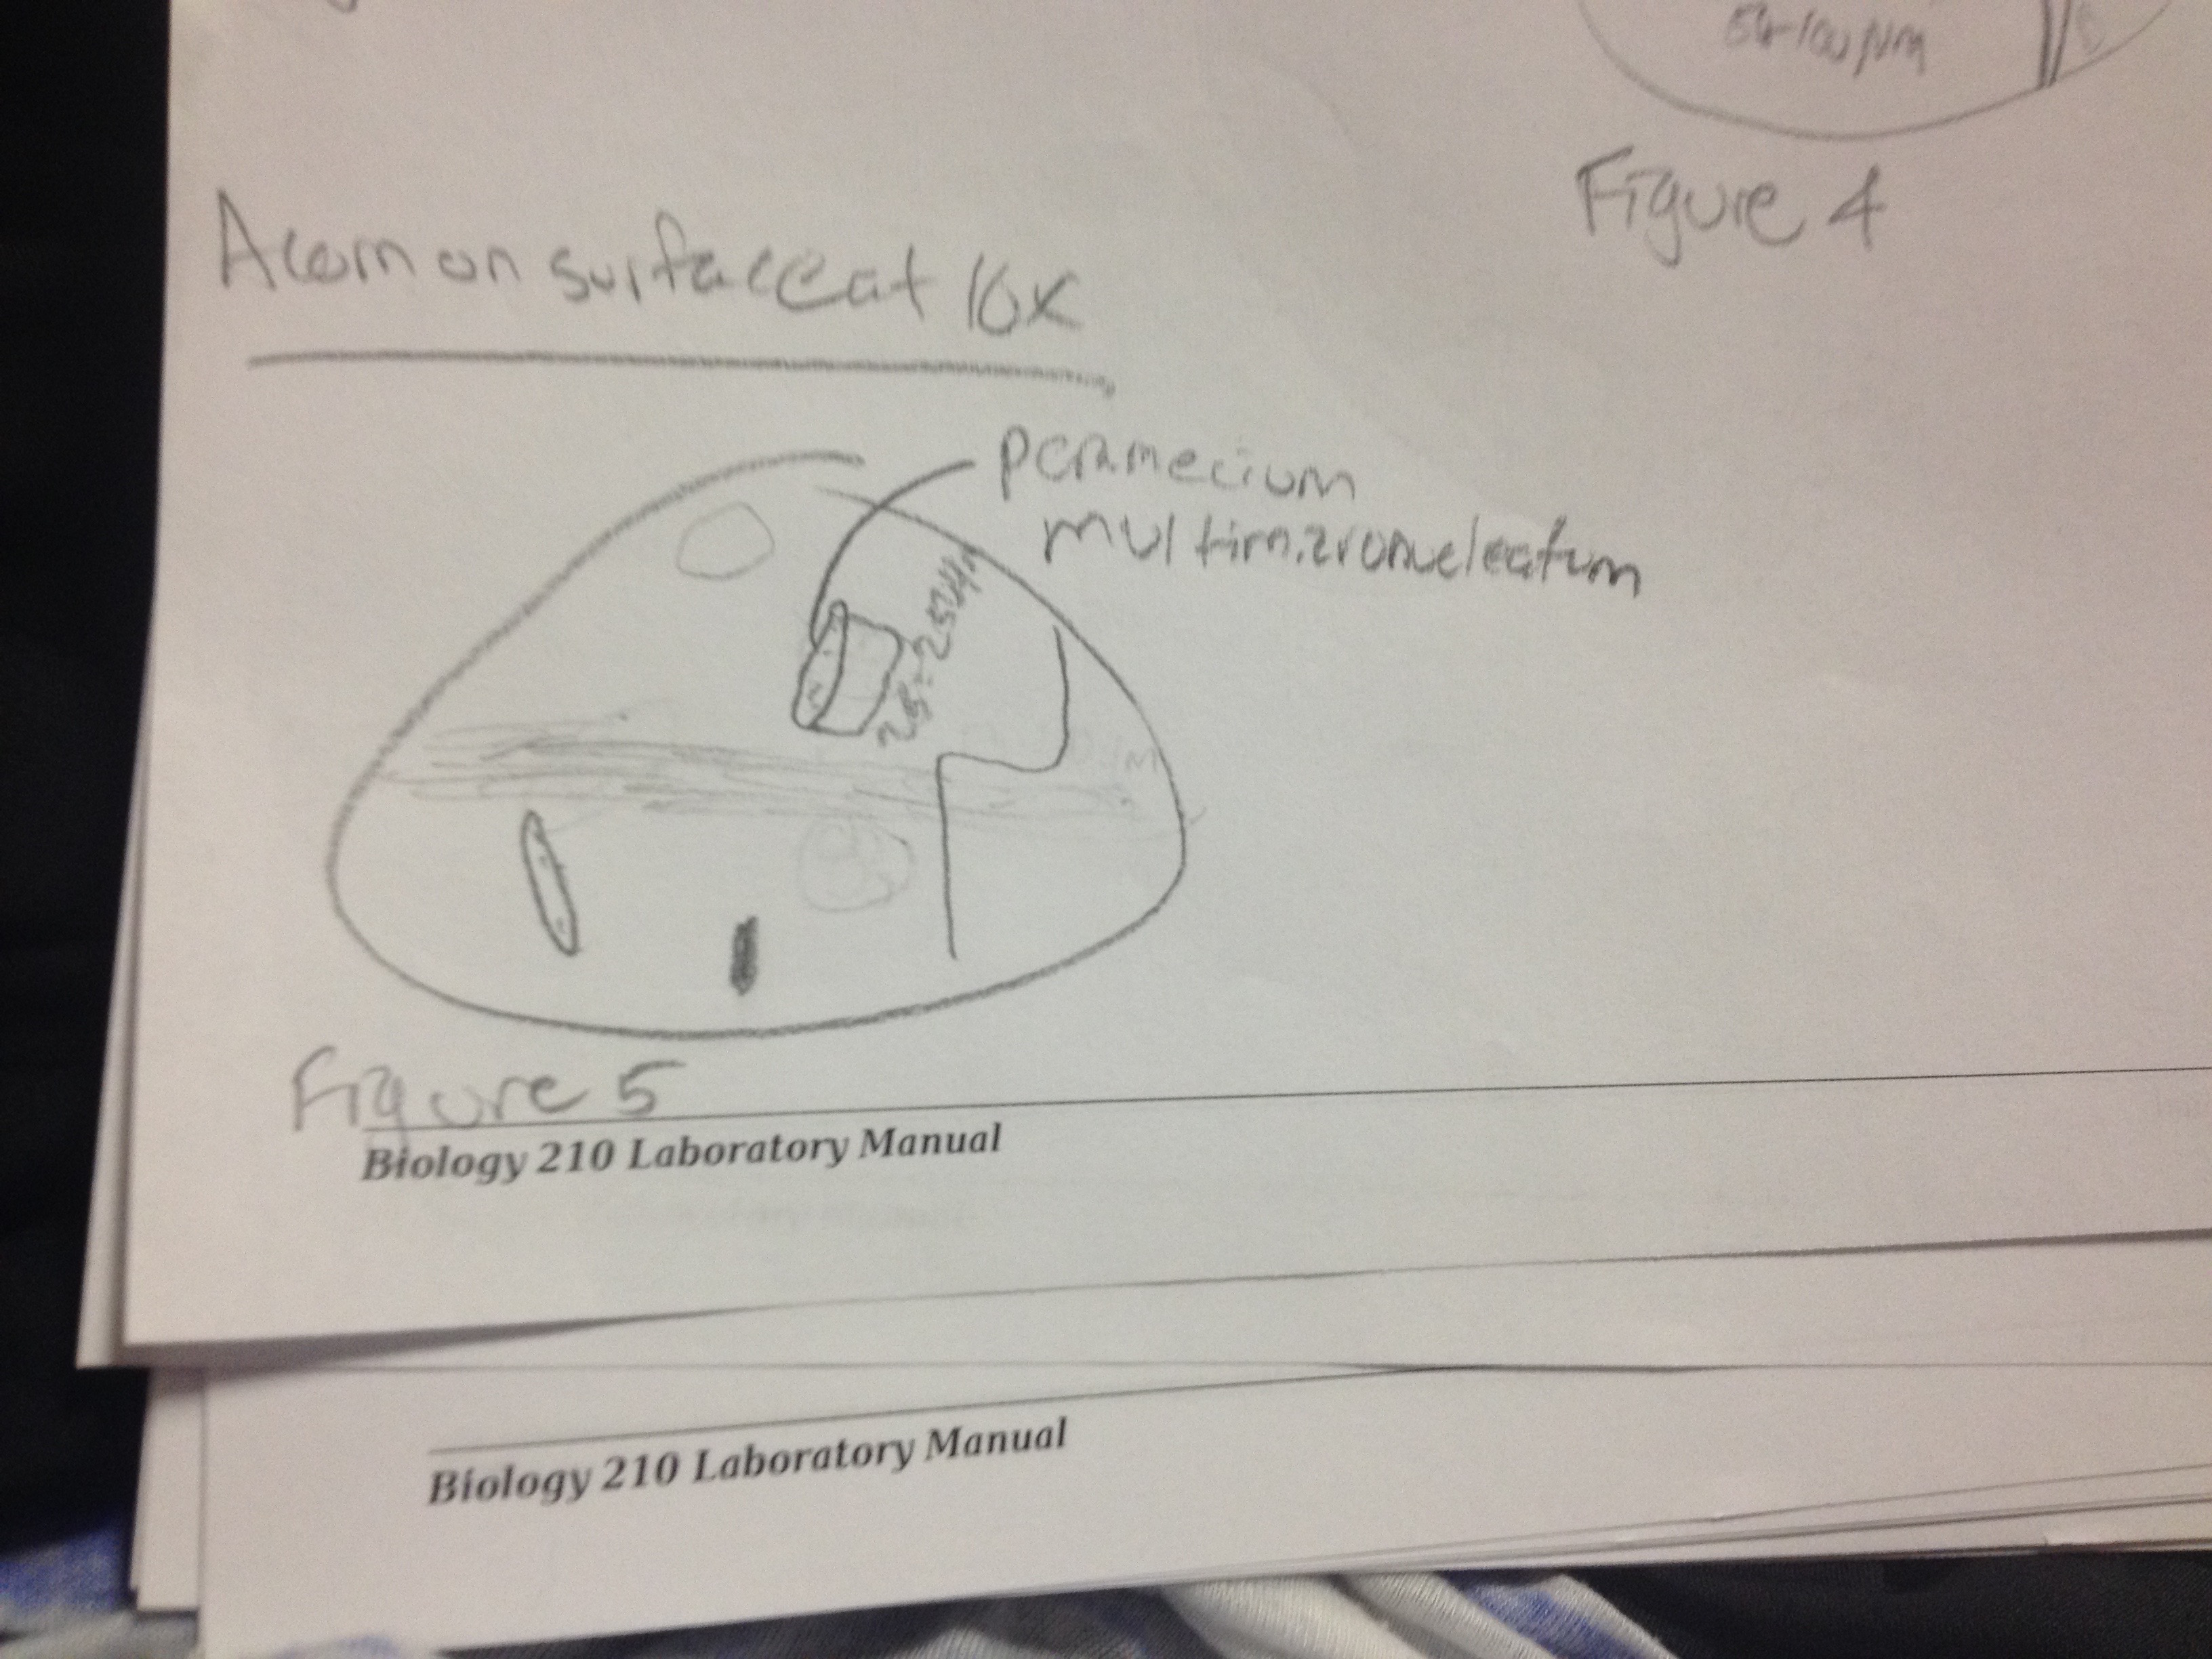
Figure 5 depicts the niche that was located near an acorn at 10x magnification. Here, paramecium multimicronueleatum existed and ranged from sizes 25-250um.
Conclusion: After locating our hay infusion, the color as a dark, murky brown. There was obvious scum on the side and a brown film on the surface of the water. The bottom was also more clear than the surface of the hay infusion. There was no apparent life located within the hay infusion. After opening the jar, the smell was repulsive. It smelled similar to rotten eggs and the top had to be put back on to avoid the pungent odor. The three organisms found within the hay infusion were paramecium, paramecium multimicronueleatum, and vorticella. All three were motile and they ranged in size from 25-250um. Paramecium use energy to move and they get this energy from feeding on microorganisms like bacteria and algae. Paramecium reproduce both sexually and asexually. They have DNA and continue to evolve to this day. If the hay infusion were to continue to grow for another month i predict that it would eventually hold no life. There would be no food because nothing is growing inside of it. Lack of food and sunlight would lead the community to die within two months.
Heres a photo of the serial dilutions we set up for next weeks lab.
J.M.
2/2/2016 Purpose: To discover the amount of bacteria in our hay infusion and how to morphological categorize these bacterium. Also, to test the antibiotic resistance in these bacterium and to use PCR and DNA sequencing and confirm our bacterial findings.
Materials and Methods: Count the number of bacteria that grew on the eight agar plates. Record findings in table 1.Collect four samples, two from the nutreint agar plates and two from the nutrient agar plates with tet. Make a wet mount and study the slides under the microscope. After categorizing the bacteria, proceed to gram staining them. After gram staining them, look at them under the microsope again. Record results in table 2. Finally, set up PCR 16s amplification.
Data and Conclusions:
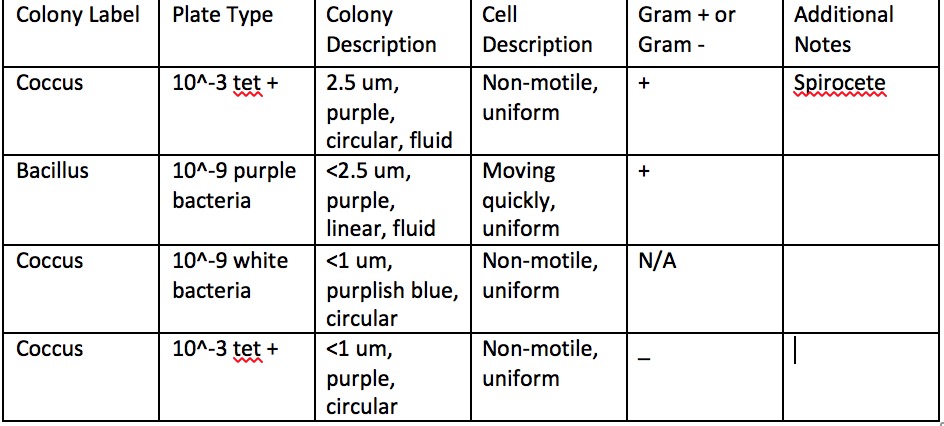
Upon observing our Hay Infusion after another week had passed, we noticed there was less water in it. This was most likely due to evaporation. Another observation was that the smell was actually better. This was surprising as I would have expected it to smell worse. However, maybe it smelled better because something that had died finally had aired out in the open jar. There was also more scum and the water was dirtier, this could be due to the dirt that was inside breaking down. Archaea species will not have grown on the plates because it is not an extreme conditions. Archaea usually grow in hot springs or salt late, not agar plates. According to our results, it seems that the agar plates without tetracycline experienced far more bacterial growth than the plates with tetracycline. this could mean that tetracycline is an efficient antibiotic that inhibits bacteria growth. However, there was one bacteria on the 10^-3 tet + that had bacterial growth. This could mean that that bacteria was resistant to the antibiotic. During this part of the lab, we ran into some difficulty. We could not identify bacteria species on the microscope with the help of the TA and UTA. It was very hard to characterize the bacteria we did find. It was even harder to accomplish the gram staining. Only a few bacteria slides were successfully gram stained. On the table, one colony could not be successfully gram stained. Because of our struggles, we could not get entirely accurate results.
Table 1: 100-fold Serial Dilutions Results

Table 2: Bacteria Characterization

Because we had such difficulty finding the bacteria, we didn't have a lot of time to draw the bacteria under the microscope. Here are four pictures that show the bacteria we did find under the microscope.
Jake Mulroy
2/9/2016 Purpose: The purpose was to discover the unique characteristics that plants evolved throughout evolution. Another part of this lab was to identify these parts and how angiosperms and bryophytes are different. the reproductive parts were also to be identified. Finally, fungi had to be tested and figured out how they are different from plants.
Materials and Methods: The first step of this lab week was to go out into our transects and bring back a leaf litter and five plant samples. The leaf litter was to be used to set up a Berlese funnel for collecting invertebrates and the plants were to be studied and identified. The next step was to look at prepared slides under a microscope. The prepared slides were of moss. The xylem and phloem were to be identified as was the height of the plant and any interesting characteristics. After this, we were to look at the five plants we collected from our transect under a microscope. The location, a description, vascularization, specialized structures, and means of reproduction were all to be identified and recorded. After this, we were to observe fungi and to locate the rhizoids. Finally, the Berlese funnel was to be constructed. This was done by taping a funnel with a screen to 25 mL of 50:50 ethanol/water. Leaves were thrown in and the funnel was placed under a 40 watt bulb.
Data and Conclusions: As shown in table 1, the plant samples were taken from a plethora of areas located within transect four. Two out of the five plants could be easily identified. One was a Persia Parrotia and the other was part of an Oak Tree. The other ones could not be identified and further procedure will have to be undertaken to identify them. As shown in table 1, all five plants did use vascularization, Which means they all had a vascular system and could grow tall as shown by the tall heights. It was hard to tell whether the seeds were monocot or dicot. Especially because we could only find the seeds of one of the plants. This seed however was monocot. Further procedures will have to be undertaken to find out whether the other seeds are monocot or dicot. In addition, all plants reproduced by seeds and about half grew flowers. A fungi sporangia holds the spores in a fungi. This is important because it is the means of reproduction that the fungi uses. All three that were studied were fungi.
Figures 1 through 3 show drawings of the plants. These plants were all pretty similar because they are from the same transect. This lab allowed us to find more information about our transect and the organisms that live in it. This lab also allowed us to find out more about fungi which are a crucial part of an ecosystem.
Jake Mulroy
2/16/2016
Purpose: The purpose of this lab week was to be able to use a dichotomous key to identify the invertebrates from our transect 4 berlese funnel. Another purpose of this lab was to be able to identify andy invertebrate using a dichotomous key as well as to be able to determine the kind of symmetry an organism has. Finally, we were to be able to describe and identify flatworms, roundworms, and annelids.
Materials and Methods: The first step in this lab was to be able to identify acoelomate using a dissecting scope. We were also supposed to be able to identify the type of movements of the invertebrates. The next step was to look at all of the invertebrates in the jars on the table. We were to identify each one using a dichotomous key and we were to group them into one of the five major classes of arthropods. The next step was to move onto our berlese funnel; the first step in this was to pour the top 10-15 mL of 50% ethanol and organisms into a petri dish. We then poured the remaining liquid into a second petri dish. we labelled the dishes top and bottom. We then took the two dishes and looked at them under a microscope. We were to identify the types of invertebrates using a dichotomous key. The results were recorded in table 1. The final step of this lab was to think of the vertebrates that existed in our transect (4).
Data and conclusions: The findings from our Berlese funnel are posted in Table 1. We discovered three different classes of invertebrates living in Transect 4, Mollusca, insect, and anthropoid. Two of these happened to be ticks which was surprising because I would not expect to find ticks in a wooded area that small. The size range of the organisms we found were from .25-10mm. The smallest was a Mollusca and another Mollusca was also the largest. The most common organism in leaf litters are insects. The sample from the two Berlese are different, the top help more organisms than the bottom one. Five types of vertebrate that may be present in our Transect are American Bullfrog(Animalia,Chordata, Amphibia, Salientia, Anura, R. catesbeiana) , Eastern Gray Squirrel(Animalia,Chordata, Rodentia,Sciuridae, Sciurus, S. carolinensis), Mourning Dove(Animalia,Chordata,Aves,Columbiformes, Columbidae,Zenaida, Z. macroura), Sparrow(Animalia,Chordata,Aves,Passeriformes, Emberizadae), and Northern cardinal(Animalia,Chordata,Aves,Passeriformes,cardinaldae, C. cardinalis). The biotic factors that would help these vertebrates would be the oak tree, the bushes, the Persian Parrotia, the pond, and the organisms living in the dirt. The abiotic factors that would help them would be the bird feeders and the water. These organisms for a community because they all share characteristics and live in the same environment. The carry capacity of this transect is how many organisms it can sustain which is pretty low. There are many trophic levels with the plants and invertebrates at the bottom and the vertebrates at the top.
Figure 1: Invertebrate Mollusca, 6/top

Figure 2: Invertebrate: Insect 2/Bottom

Figure 3: Invertebrate: Mollusca 4/Top

Figure 4: Invertebrate: Arthropoda 3/Top

Figure 5: Invertebrate: Arthropoda: 7/Top

J.M.
2/24/2016
Our zebrafish experiment will take 24 zebrafish embryos and have them grow in a control and two independent variables. The control is four zebrafish placed in 2mL of water. Next is 10 zebrafish placed in 2mL of ethanol 1%. Finally, 10 zebrafish will be put into 1mL of ethanol 1% and 1mL of water. This experiment is to test the effect of ethanol on zebrafish development. Does ethanol cause any defects? This experiment set out to discover this as well as the effect that some water and some ethanol can have on development. J.M.
3/2/16 Purpose: The purpose of this lab was to amplify the DNA of the bacteria collected from our transect (4) and analyze it.
Materials and Methods: The first step was to construct a Berlese Funnel. This was done by taping a funnel with a screen to 25 mL of 50:50 ethanol/water. Leaves were thrown in and the funnel was placed under a 40 watt bulb. After a week, the bacteria was collected and a 16S sequence analysis was undertaken. One normal agar plate and one agar plate with tet+ was used to PCR. This would allow us to identify the bacteria and genes involved.
Conclusion: The 16S sequencing failed possible due to the primer. There were no meaningful conclusions from this test about the bacteria found in our transect. J.M.
3/23/2016 Zebrafish Experiment
Purpose: The purpose of this experiment was to determine the effects that ethanol has on the development of zebrafish. . The hypothesis constructed was that if the zebrafish were submerged in the 1.0% alcohol solution, they will mature the slowest and have the highest mortality rate. The zebrafish in 0.5% alcohol will grow intermediately and show a lower mortality rate. Finally, the zebrafish in the control (0.0% alcohol) will grow the fastest and have a zero mortality rate.
Materials & Methods: After choosing ethanol as the independent variable in this experiment, the zebrafish embryos had to be collected. The 20 zebrafish were then transferred to a dish with twenty different sections. The fish were then organized into four sections containing 2mL of Deerpark Water, 10 containing 0.5% ethanol, and the last 10 containing 1.0% ethanol. 10 contained 1.0% ethanol. An observation schedule was then created so that each day, an experimenter could come in and record the embryo development as well as add more treatment fluid. On day 5, 10mls of water and empty egg cases were removed and 25mls of fresh water was added. Dead zebrafish were fixed and in the end, all remaining zebrafish were to fixed, leftover were to be returned to TA Cassie.
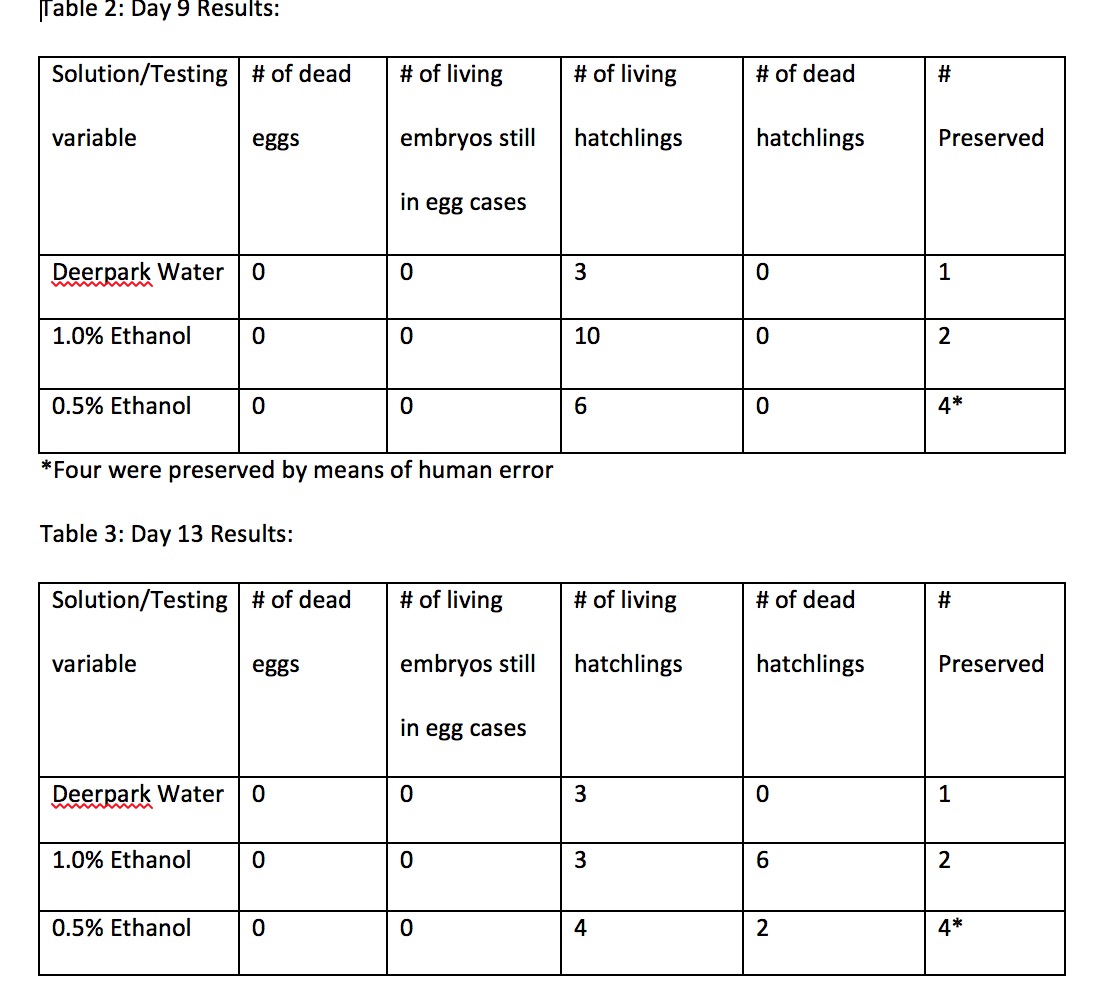
Results and Figures: Tables 1-4 show the development of the zebrafish in their respective test fluid.

Discussion: Our results in the end supported our hypothesis. The control fish in the Deerpark water all survived. 4 out of the 10 fish treated with 0.5% ethanol survived the experiment. Only 2 out of the 10 fish treated with 1.0% ethanol survived the experiment. The fish that were exposed to ethanol during development had smaller organs and bodies compared to the fish i the control. Obviously, ethanol can have adverse effects on the development of zebrafish. In the future, embryos and ethanol should never be mixed or else results like those in our experiment could be seen. Future testing should occur to determine if ethanol can have the same effects in larger organisms.
J.M.


