BME100 f2015:Group10 1030amL2
| Home People Lab Write-Up 1 | Lab Write-Up 2 | Lab Write-Up 3 Lab Write-Up 4 | Lab Write-Up 5 | Lab Write-Up 6 Course Logistics For Instructors Photos Wiki Editing Help | ||||||
|
OUR TEAM
LAB 2 WRITE-UPDescriptive StatisticsExperiment 1 http://openwetware.org/images/1/10/Snip20150915_2.png
ResultsExperiment 1
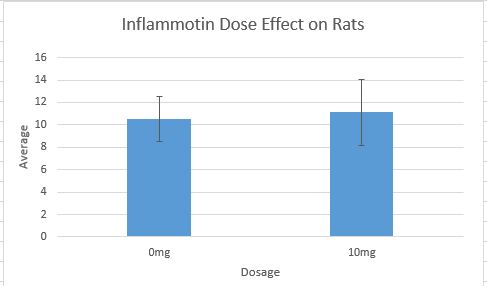
http://openwetware.org/images/f/fd/BMERATGRAPH.JPG
AnalysisExperiment 1 The P-value of the ANOVA for 0 to 15 mg was much lower than the alpha of 0.05, meaning that we can have over 95% confidence that there was a difference between the dosages on inflammotin levels.
Conducting a post-hoc, we discovered that each dosage's effect on inflammotin levels compared to each other was significantly different by an alpha of 0.05/4 = 0.0125. Experiment 2
      0mg  	        10mg
       9.24	        22.34
       8.76	         6.45
      8.78	       14.23
      13.5	        3.55
      12.3	        8.99
Average 10.516 ; 11.112 Count 5 ; 5 Standard dev 1.990593881; 6.621342462 SE 0.890220647 ; 2.961154369 T-test value: 0.867403497 Above is a table of values over five trials. A dosage of 0mg and 10mg of LPS along with the inflammotin levels are displayed in the table. The average of the results for the 0mg column was 10.516 and the average results for the 10mg group was 11.112. The results in the first dosage (0mg) had little varying data, but there was still a degree of variance. The 10mg data had a large variance. In our graph, the data standard deviation was very high and it is most likely the result of large degree of variance. The degree of variance is most likely the result of an inadequate sample size of rats and lack of multiple dosages. The T-test value is well above 0.65 which means the data is insignificant. By testing with multiple dosage amounts, the results may have had a closer correlation and would likely have been more consistent. This will also make the data more significant in the experiment. Also, the rats tested may have been very different in terms of how their bodies responded to the dosages of inflammotin. It is important to include a larger, more random sample size to even out the large variations in the data.
Summary/DiscussionExperiment 1 The experiment showed that each dosage of LPS had significantly different effects on the levels of inflammotin in the elderly. In humans, the drug has been shown to have different effects with greater than 95% confidence. Each of the t-tests done in the post-hoc indicates that the dosages were significantly different than each other on the inflammotin levels in the elderly. There is a definite effect from the dosages of the drug tested in humans. Experiment 2 The graph for experiment two, the rat test, contains largely varied values. The doses were 0 and 10 mg and there were five rats tested on a 0mg sample and 5 rats tested on the 0mg sample. Since the values varied largely, the p value was very insignificant. The value was 0.867403. The variation might have been a result of the lack of other variables used in the experiment. The rats were divided into simply two groups with only two amounts of inflammotin tested. Since the experiment set up was rather vague, the results were not as uniform. As a result, the data were insignificant. Looking at both experiments, it is interesting to see where the two differ, even though the same drug was used. While the 0 mg and 10 mg in humans had a significant effect, they had no such effect in rats. The same drug and amounts were used, but the factor of using different species caused a significant difference in response and may give insight into physiological differences between the two species. |
||||||


