BME100 f2014:Group29 L2
Study conducted on human subject and rat subjects:
Introduction: A study was preformed to measure the inflammotin levels in rats and humans given different dosages of LPS. Rats were given dosages of 0 and 10 mg of LPS whereas dosages of 0, 5, 10, and 15 mg of LPS were measured in the human subjects. This study was conducted to find if there is a statical difference between the inflammotin levels of subjects given different dosages.
Data for the Human study:
| LPS Dose (mg) | Inflammotin (pg/ml) | Age | LPS Dose (mg) | Inflammotin (pg/ml) | Age | LPS Dose (mg) | Inflammotin (pg/ml) | Age | LPS Dose (mg) | Inflammotin (pg/ml) | Age |
|---|---|---|---|---|---|---|---|---|---|---|---|
| 0 | 5.23 | 72 | 5 | 10.72 | 73 | 10 | 100.19 | 82 | 15 | 793.17 | 81 |
| 0 | 1.01 | 60 | 5 | 9.29 | 69 | 10 | 75.92 | 65 | 15 | 476.67 | 62 |
| 0 | 4.23 | 65 | 5 | 8.46 | 67 | 10 | 23.46 | 60 | 15 | 771.45 | 66 |
| 0 | 1.87 | 62 | 5 | 10.19 | 74 | 10 | 70.87 | 68 | 15 | 795.09 | 76 |
| 0 | 3.67 | 66 | 5 | 7.29 | 66 | 10 | 19.27 | 61 | 15 | 181.27 | 60 |
| 0 | 2.98 | 63 | 5 | 7.54 | 65 | 10 | 99.65 | 82 | 15 | 752.78 | 65 |
| 0 | 5.83 | 73 | 5 | 8.67 | 68 | 10 | 38.37 | 67 | 15 | 934.23 | 78 |
| 0 | 5.24 | 71 | 5 | 6.15 | 60 | 10 | 76.26 | 67 | 15 | 554.87 | 63 |
| 0 | 4.27 | 68 | 5 | 10.92 | 70 | 10 | 35.25 | 60 | 15 | 692.23 | 65 |
| 0 | 4.01 | 67 | 5 | 10.09 | 69 | 10 | 76.98 | 68 | 15 | 627.65 | 63 |
ANOVA test for human experiment:
Out of the two tests that can be preformed to find statistical differences in data, the ANOVA test was better suited for the human trials. The ANOVA test was implemented because there are four sets of data to be evaluated; dosages of 0, 5, 10, and 15 mg were tested in groups of ten subjects, each dosage making a different set of data. A t-test can only be used to calculate the statistical difference between two sets of data, leaving the ANOVA test as the only option for evaluation.
Post-ANOVA t-test:
By this post-ANOVA test, it was determined that there is a statistical difference between each data set. Each set tha was examined fell below the calculated p-value.
Graph of human experiment:
Data for the rat experiment:
| LPS Dose (mg) | Inflammotin (pg/ml) | LPS Dose (mg) | Inflammotin (pg/ml) |
|---|---|---|---|
| 0 mg | 9.24 | 10 mg | 22.34 |
| 0 mg | 8.76 | 10 mg | 6.45 |
| 0 mg | 8.78 | 10 mg | 14.23 |
| 0 mg | 13.5 | 10 mg | 3.55 |
| 0 mg | 12.3 | 10 mg | 8.99 |
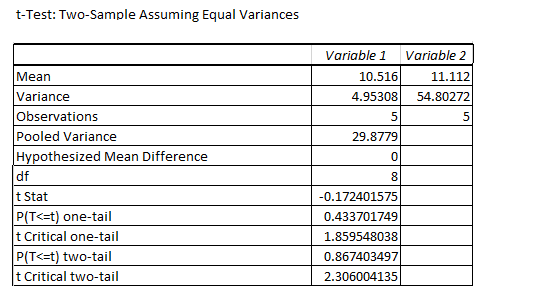
T-test for rat experiment:
A t-test was implemented in the case of the rat subjects because dosages of 0 and 10 mg were tested. The t-test is used when an experiment consisting of only two sets of data is run. In this case, only two sets of data were yielded, so the t-test was the best option. The p-value determined by this test shows that there is not a statistical difference between each set of data.
Graph of rat experiment:
Inferential statistics:
The data on the human study has shown that there is a statistical difference between each dosage given to each subject, further testing post-hoc anova tests on humans supports the evidence that the LPS is causing a significant effect on the patients inflammotin levels. The calculated p-value for the post-ANOVA test yielded that all values had to fall below .0083333 to be statistically significant. As shown above, all values did fall below the p-value. On the other hand the rats showed high deviations between each other. The p-value of which was .867 fell well below the acceptable .95, meaning that this data did not show a statistically significant difference between the rats inflammation levels between the dosages.
Summary: Of the two studies done, one study showed a statistical difference between LPS dosage and inflammotin levels while one did not. From the data, it is gathered that inflammotin levels significantly changed in humans when given different dosages of LPS whereas these levels did not change significantly in rats. Together, these two studies show that, although inflammotin levels did not change much in rats, the levels did change much in humans, which shows that rats are not affected by this medication, but humans are, deeming this a sucessful experiment.


