Alyssa N Gomes Week 7 Journal
Week 7 Assignment
==Matlab files and graphs used for our presentation:==
Matlab function for rates of concentration
Matlab script for rates of concentration
When all rates are set to 1
When r2 is set to 4
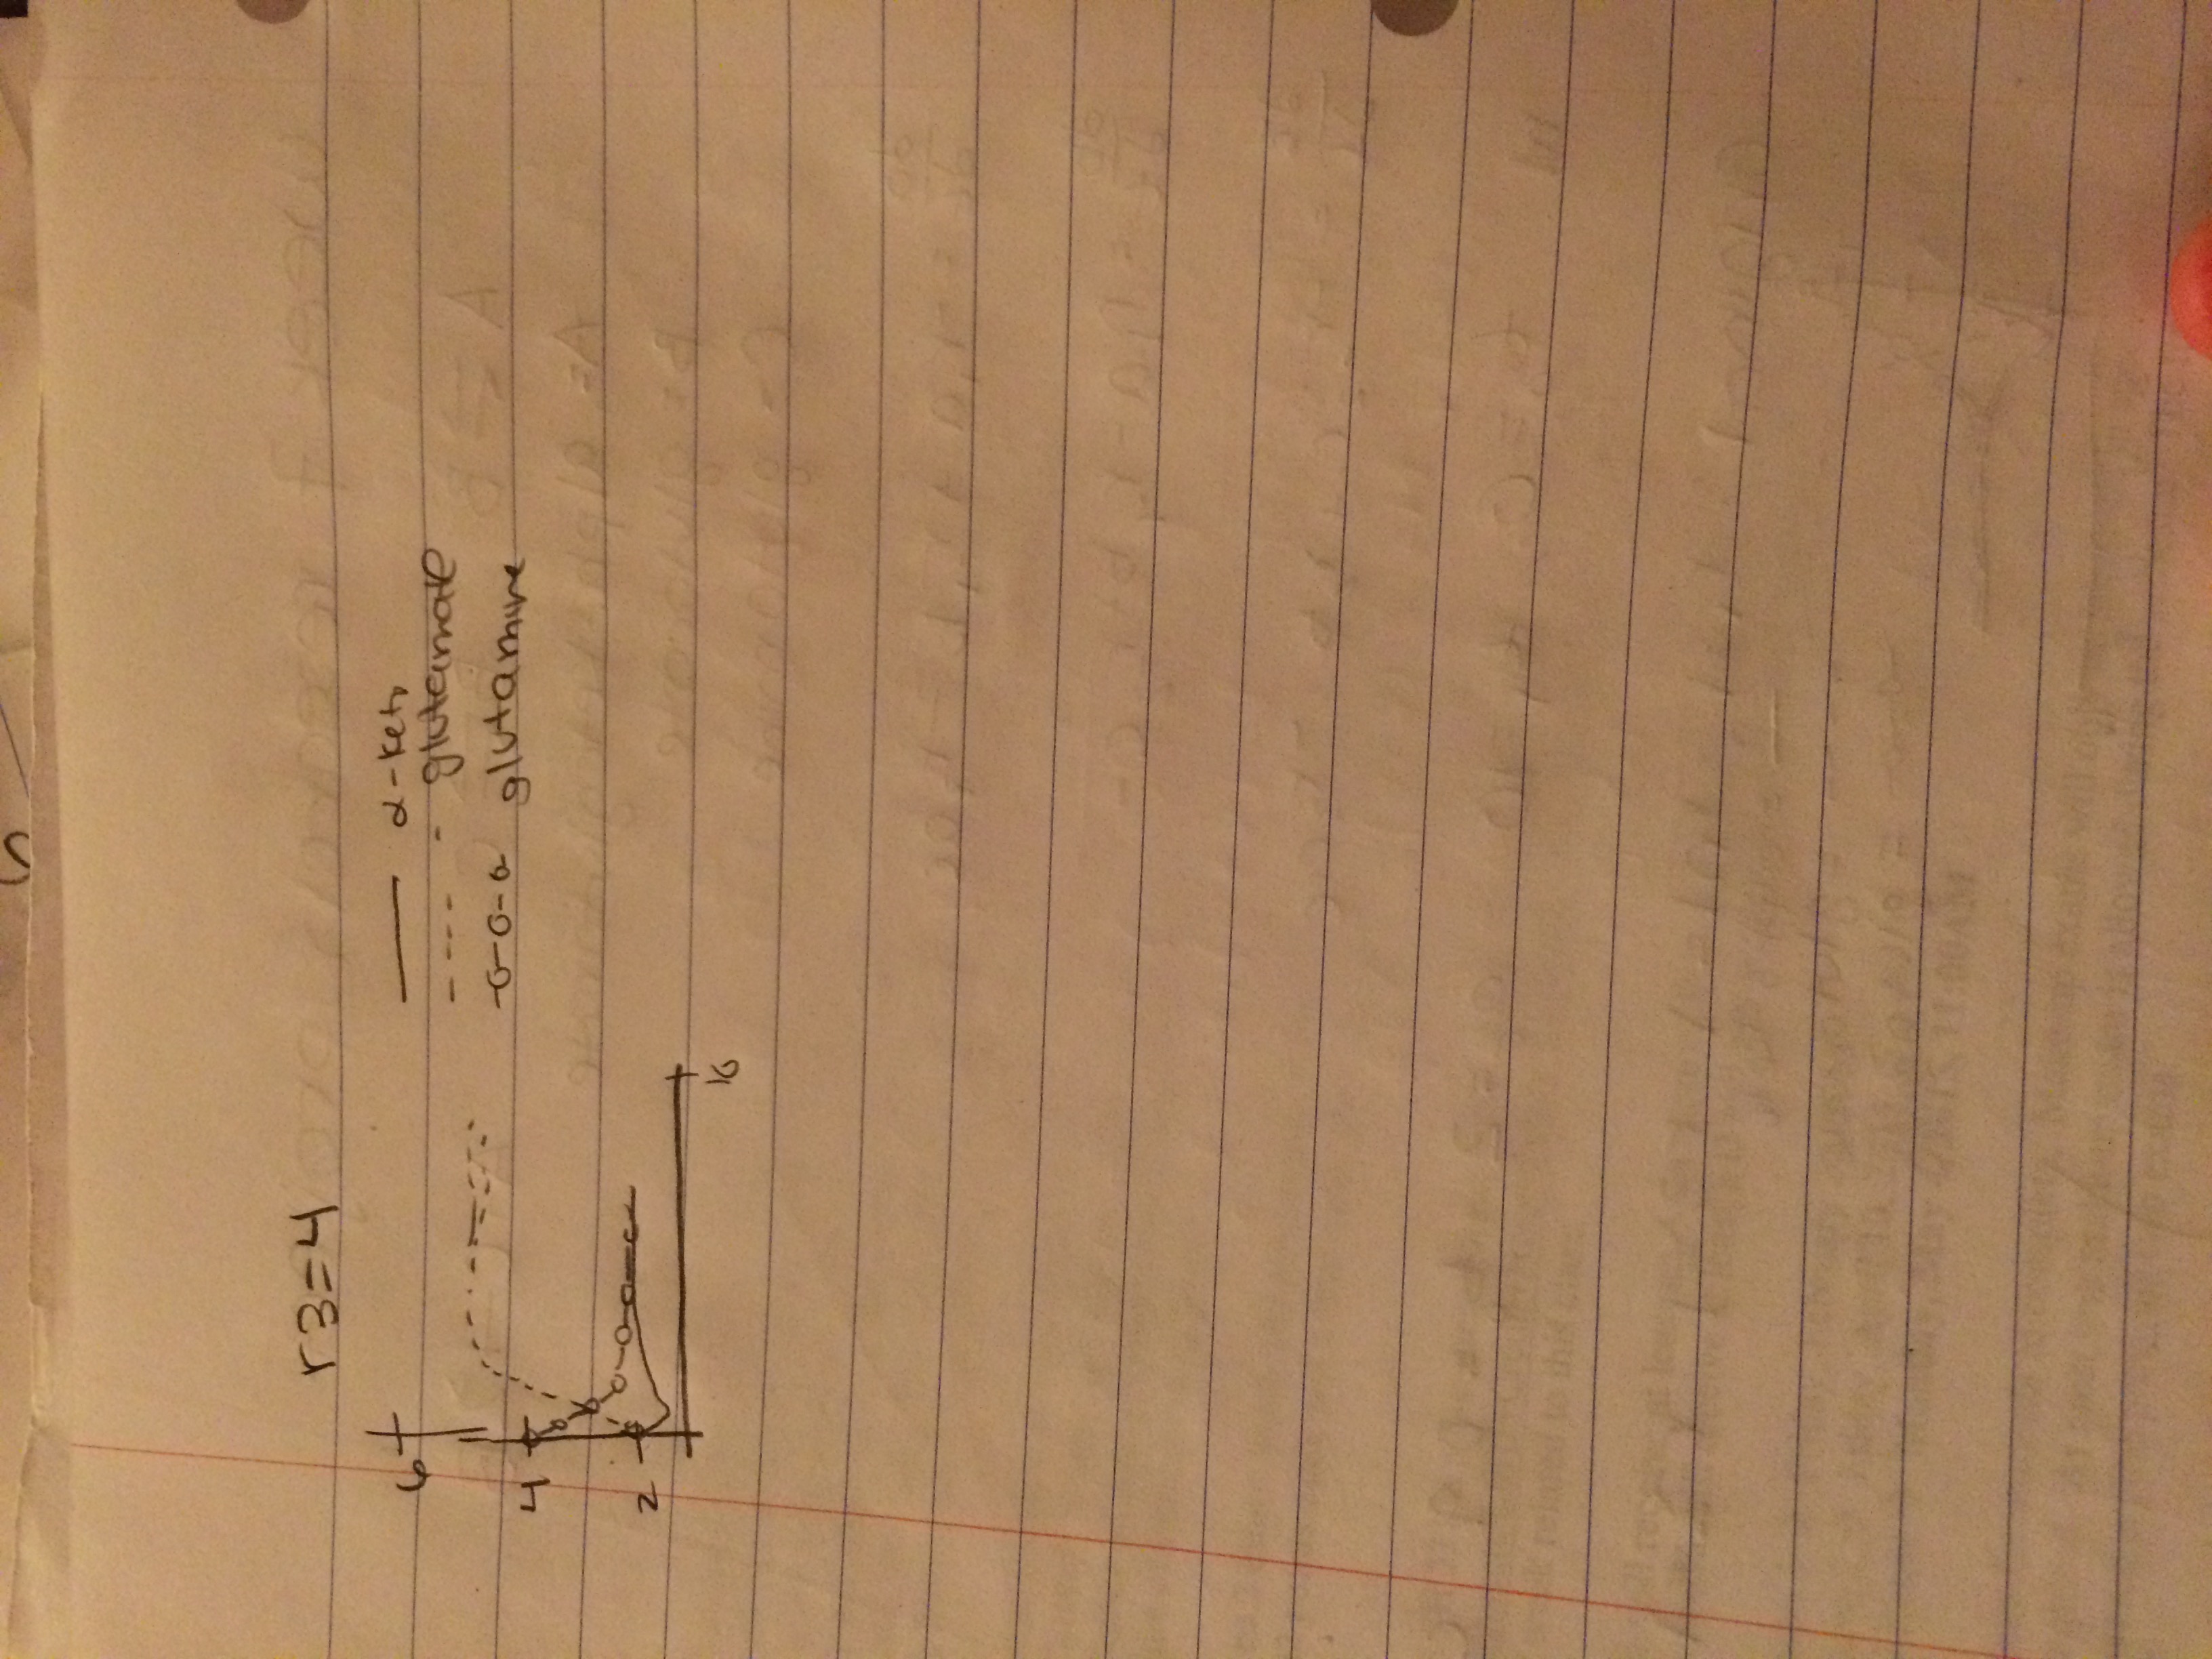
When r3 is set to 4
Presentation
Notes Taken
Notes on Journal pt 1
Notes on Journal pt 2
For this assignment, I was paired with Tessa Morris. We used our notes and previous chemostats used in earlier weeks to modify and adapt for our model. In order to see how rates changed the overall graphs and outcome of the rates of substrates, we originally set all values to 1, and initial concentrations of alpha-ketoglutarate, glutamate and glutamine to random values. By changing r2, the rate for glutamine, we saw a graph that modified the the different values of the graph. By changing r3, the rate that changed alpha-ketoglutarate and glutamine we saw a graph that was upon an increased scale of the original graph. In the end, we analyzed these and compared it with the information given in ter Schure et al. (1995) to attempt to see the bigger picture. We made a powerpoint presentation, using the guidelines given and are ready to present on Thursday.