User:Michael F. Nagle/Notebook/Chem 571/2012/10/31: Difference between revisions
From OpenWetWare
No edit summary |
|||
| Line 13: | Line 13: | ||
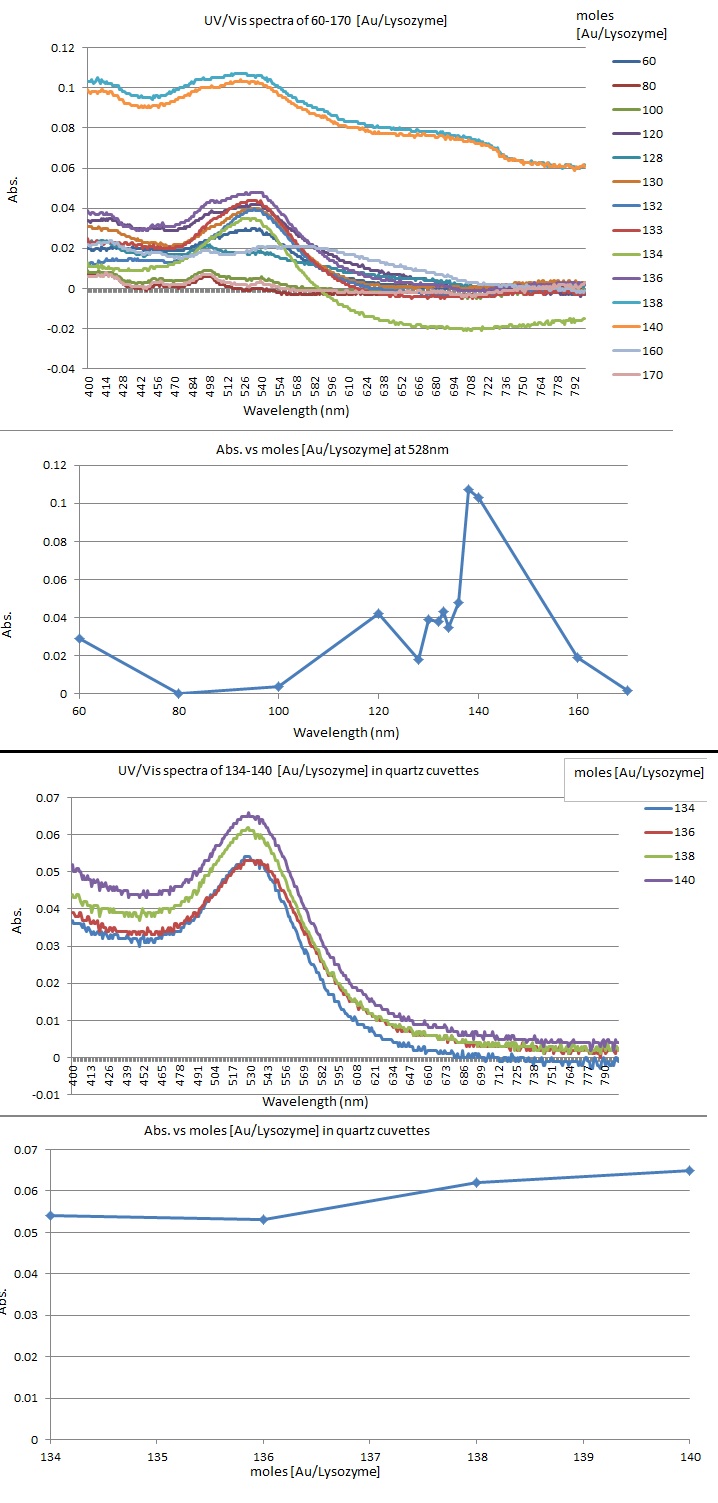
*Samples from 134-140 showed variation in the background. In order to determine whether this was due to Lysozyme or variation in cuvettes, these trials were repeated using the same quartz cuvette. A blank of water was run using the same cuvette and subtracted from each spectra manually. | *Samples from 134-140 showed variation in the background. In order to determine whether this was due to Lysozyme or variation in cuvettes, these trials were repeated using the same quartz cuvette. A blank of water was run using the same cuvette and subtracted from each spectra manually. | ||
*[[User:Puja_Mody/Notebook/Chem_571:_Gold_Nanoparticles/2012/10/31|Puja Moody]] purified ADA from E. Coli grown [[User:Michael_F._Nagle/Notebook/Chem_571/2012/10/23|last week]] | *[[User:Puja_Mody/Notebook/Chem_571:_Gold_Nanoparticles/2012/10/31|Puja Moody]] purified ADA from E. Coli grown [[User:Michael_F._Nagle/Notebook/Chem_571/2012/10/23|last week]] | ||
==Data== | |||
[[Image:Quartzlys.jpg]] | |||
==Discussion== | |||
*In the abs. vs mole ratio plot for the first round, done using plastic cuvettes, a jagged line is seen from 134-140. A significant change in backgrounds is seem on the wavelength vs. absorbance graph. Because of this, we analyzed these samples again using quartz cuvettes. | |||
*Starting at 100, an increasing amount of AuNPs appear in solution. This peaks at 140 before decining to near-zero at 170. This indicates that the optimal mole ratio for AuNPs in solution is 140 and that they start to go into fibers at higher mole ratios. | |||
<!-- ##### DO NOT edit below this line unless you know what you are doing. ##### --> | <!-- ##### DO NOT edit below this line unless you know what you are doing. ##### --> | ||
|} | |} | ||
__NOTOC__ | __NOTOC__ | ||
Revision as of 04:11, 7 December 2012
| <html><img src="/images/9/94/Report.png" border="0" /></html> Main project page <html><img src="/images/c/c3/Resultset_previous.png" border="0" /></html>Previous entry<html> </html>Next entry<html><img src="/images/5/5c/Resultset_next.png" border="0" /></html> | |
Objectives
Procedure
DataDiscussion
| |
