User:Mary Mendoza/Notebook/CHEM 571 Experimental Biological Chemistry I/2012/10/24: Difference between revisions

From OpenWetWare
Jump to navigationJump to search
Line 42: Line 42:
* The trend seen on the graph is accurate with the observations made from the physical state of the Au/BSA solutions. Mole ratio 60, 80, and 120 were the solutions that exhibited no fibers and had the consistent clear purple color.
* On the graph, mole ratios 60, 80, and 120 have high absorbances. According to Beer's law, absorbance is directly proportional to the molar absorptivity, path length, and concentration of the substance. Therefore, mole ratio 120 displaying the greatest absorbance peak has the greatest concentration of aqueous gold nanoparticles in solution. This is followed by mole ratio 80 and 60.  
 
* Mole ratios 130 and 133 had fibers suspended in a clear and colorless solution. These solutions can be seen having some absorbance at the 510 nm region.


<!-- ##### DO NOT edit below this line unless you know what you are doing. ##### -->

Revision as of 13:04, 27 October 2012

Project name <html><img src="/images/9/94/Report.png" border="0" /></html> Main project page
<html><img src="/images/c/c3/Resultset_previous.png" border="0" /></html>Previous entry<html>&nbsp;&nbsp;&nbsp;&nbsp;&nbsp;&nbsp;</html>Next entry<html><img src="/images/5/5c/Resultset_next.png" border="0" /></html>

Transformation of BL21 cells

The following procedures were conducted near the proximity of the Bunsen burner in accordance with aseptic techniques. The procedure is based from the laboratory Transformation protocol.

  • Transferred 5 μL of PCR plasmid in two sterilized tubes. One tube will be filled with LB media, the other with SOC media. Both media are from Novagen.
  • Added 40 μL of thawed BL21 cells into each tube. The tubes were immediately placed on a VWR analog heatblock at 42°C for 30 sec.
  • After the 30 sec. mark, the tubes were submerged in ice. This rapid change in temperatures is a method of heat shock. This is an adequate of method of allowing the cells to incorporate the mutated plasmid into their intracellular matrix.
  • Delivered 250 μL of the LB and SOC media using an automatic delivery pipet into the labeled tubes.
  • The tubes containing the media were centrifuge for 1 h. at 37°C by Dr. Miller.
  • During the latter of the lab period, 2 plates were inoculated for each cell grown in LB and SOC media.
  • The first plate was inoculated with 50 μL of the BL21 cell grown in LB; the second plate was inoculate with a greater volume of cells with 200 μL.
  • Dhea Patel plated the BL21 cells grown in SOC media.

UV-Vis of Au/lysozyme solution

  • During the previous lab period of 10/23/12, the Au/lysozyme solutions were incubated at 50°C. The solutions were observed to this date to exhibit no fibers.
  • Mole ratio 100 exhibited a slight purple tint. A UV-Vis scan was taken for this mole ratio. The graph of values are embedded below.


  • The low temperature might have not denatured the lysozyme. Therefore, lysozyme could have not efficiently reduced Au (III) ito Au (0). The solution was re-incubated at a higher temperature, 85°C for 4h.


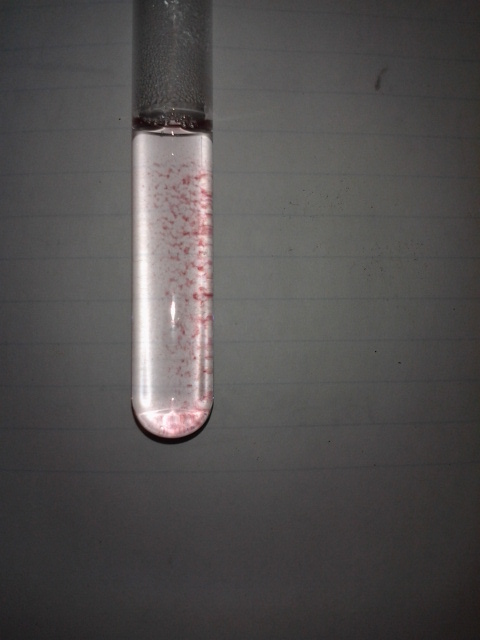
  • As advised by Dr. Miller, the solutions were checked during the incubation period. There were observable aggregation as seen below. The photo below is for the mole ratio 170.


UV-Vis scans of Au/BSA


  • The trend seen on the graph is accurate with the observations made from the physical state of the Au/BSA solutions. Mole ratio 60, 80, and 120 were the solutions that exhibited no fibers and had the consistent clear purple color.
  • On the graph, mole ratios 60, 80, and 120 have high absorbances. According to Beer's law, absorbance is directly proportional to the molar absorptivity, path length, and concentration of the substance. Therefore, mole ratio 120 displaying the greatest absorbance peak has the greatest concentration of aqueous gold nanoparticles in solution. This is followed by mole ratio 80 and 60.
  • Mole ratios 130 and 133 had fibers suspended in a clear and colorless solution. These solutions can be seen having some absorbance at the 510 nm region.