User:Khyra A. Neal/Notebook/Chem 571/2014/09/10: Difference between revisions
From OpenWetWare
No edit summary |
|||
| Line 75: | Line 75: | ||
==Data Analysis== | ==Data Analysis== | ||
* | 1. Purity of BSA stock solution | ||
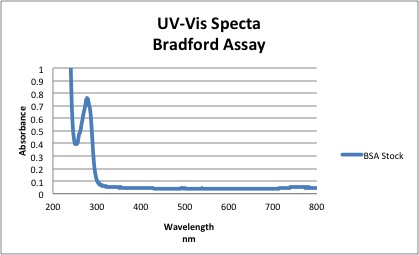
* | [[Image:BSAPurity.jpg]] | ||
Based on the spectra above, the absorbance of BSA at 280 nm = 0.761 | |||
* Using Beer Lambert Law →A= Ε L C | |||
** c=0.761/ 43824 = 1.736 X 10<sup>-5</sup>M | |||
**Purity= [UV Measured] / [Mass Measured] *100 | |||
***1.736 X 10<sup>-5</sup>M / 1.5204 X 10<sup>-5</sup>M *100 = 114% | |||
'''NOTE''' The extinction coefficient for BSA at 280 nm was found in literature to be 43,824. The percent purity of BSA was found to be greater than 1 possibly indicating that the polystyrene cuvettes weren't completely clean or BSA did not dissolve completely in solution and stuck to the cuvette. | |||
*Because the Bradford reagent has peaks at 460 nm and 630 nm and the Bradford-protein complex has a peak near 600, there will be significant overlap. A difference spectra is constructed to make up for the difference and is shown below: | |||
[[Image:BSADifferenceSpectra.jpg]] | |||
<!-- ##### DO NOT edit below this line unless you know what you are doing. ##### --> | <!-- ##### DO NOT edit below this line unless you know what you are doing. ##### --> | ||
__NOTOC__ | __NOTOC__ | ||
Revision as of 23:13, 16 September 2014
| <html><img src="/images/9/94/Report.png" border="0" /></html> Main project page <html><img src="/images/c/c3/Resultset_previous.png" border="0" /></html>Previous entry<html> </html>Next entry<html><img src="/images/5/5c/Resultset_next.png" border="0" /></html> | |||||||||||||||||||||||||
September 10, 2014Bradford AssayPrepare Stock Solutions
UV-Vis AnalysisRecord UV-Vis Spectrum for stock solutions (BSA, Saline Solution, and Tris Buffer)
NOTE ALL UV-Vis spectra were run using polystyrene cuvettes. Solutions were discarded in waste bottle and polystyrene cuvettes were placed in a wash tube for cleaning. Data Analysis1. Purity of BSA stock solution
NOTE The extinction coefficient for BSA at 280 nm was found in literature to be 43,824. The percent purity of BSA was found to be greater than 1 possibly indicating that the polystyrene cuvettes weren't completely clean or BSA did not dissolve completely in solution and stuck to the cuvette.
|
|||||||||||||||||||||||||

