User:Jamie Nunziata/Notebook/Protease Research/2015/09/29: Difference between revisions
No edit summary |
(→Data) |
||
| Line 28: | Line 28: | ||
==Data== | ==Data== | ||
<b>Concentrations of our stock solutions:</b> | <b>Concentrations of our stock solutions:</b><br> | ||
Concentration of A = 1µM | <br>Concentration of A = 1µM | ||
Concentration of B = 0.5µM | <br>Concentration of B = 0.5µM | ||
Concentration of C = 0.25µM | <br>Concentration of C = 0.25µM | ||
Concentration of D = 0.125µM | <br>Concentration of D = 0.125µM | ||
Concentration of E = 0.0625µM | <br>Concentration of E = 0.0625µM | ||
Concentration of F = 0.03125µM | <br>Concentration of F = 0.03125µM | ||
Concentration of G = 0.015625µM | <br>Concentration of G = 0.015625µM | ||
Concentration of H = 0.007813µM | <br>Concentration of H = 0.007813µM | ||
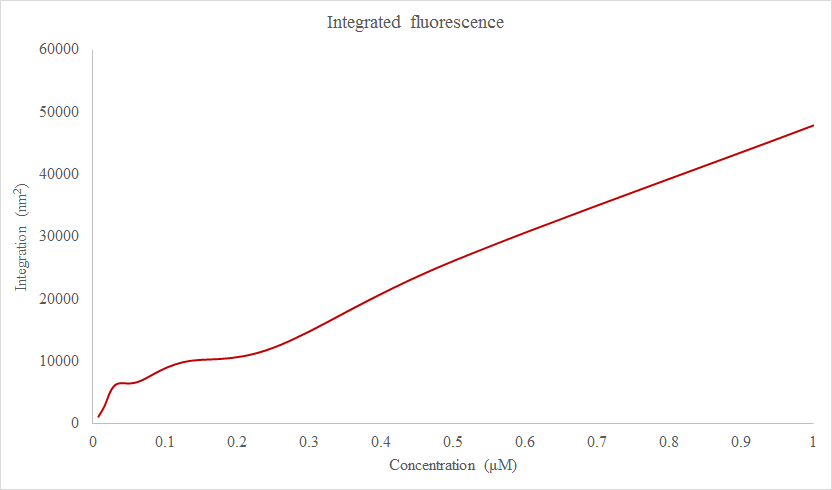
Figure 1: | <u>Figure 1:</u> | ||
[[Image:Nunziata_Fluorescence_Degradation_9_30_2015.png]] | [[Image:Nunziata_Fluorescence_Degradation_9_30_2015.png]] | ||
| Line 45: | Line 45: | ||
Figure 2: | <u>Figure 2:</u> | ||
[[Image:Nunziata_IntegratedFluorescence_9_30_2015.png]] | [[Image:Nunziata_IntegratedFluorescence_9_30_2015.png]] | ||
Revision as of 15:21, 3 October 2015
| <html><img src="/images/9/94/Report.png" border="0" /></html> Main project page <html><img src="/images/c/c3/Resultset_previous.png" border="0" /></html>Previous entry<html> </html>Next entry<html><img src="/images/5/5c/Resultset_next.png" border="0" /></html> | |
ObjectiveThe objective of today's lab is to measure the degradation of our protease, alpha-chymotrypsin, in the presence of lysozyme by measuring the fluorescence of just our protease at varying concentrations and comparing it to the fluorescence of our protease with lysozyme at each of the concentrations.
ProcedureFirst, a 1.04 mg/mL lysozyme in buffer solution was made by dissolving 52mg of lysoyme in ~5 mL of phosophate buffer, as measured in a 5mL volumetric flask. 1mL of HPLC was then added to our previously weighed protease samples, alpha chymotrypsin, to create a concentration of 36.84 µM. To create a 1mL sample that is 1µM, we used the equation M1V1=M2V2 to mathematically determine the volume of our protease solution and lysozyme buffer solution needed. From this calculation, 25.1µM of protease solution and 974.9µM of lysozyme buffer solution to bring the final volume to 1mL. We repeated this process for a blank solution by adding 974.9µM of phosphate buffer without lysozyme to the 25.1µM of protease sample. 8 1.5mL Eppindorf tubes were created and labeled A-H for both the blank and the lysozyme samples (16 tubes total). Sample A was pure solution of either the blank or lysozyme added solutions created above. A serial dilution of both the blank and lysozyme solutions for samples B-H by diluting the concentrations by one half each time (75mL of HPLC water and 75mL of the previous standard solution). In separate 1.5 mL Eppindorf tubes, each solution created consisted of 20µM of blank or lysozyme added solution along with 140µM of Assay Buffer and 40µM of Assay Reagent. These new solutions were then individually measured in 1mL fluorescence cuvette on the fluorometer at the following specifications: excitation: 390nm, emission: 400-650nm.
DataConcentrations of our stock solutions:
| |

