User:Jamie Nunziata/Notebook/Protease Research/2015/09/23: Difference between revisions
(→Data) |
(fix raw html notebook nav) |
||
| (4 intermediate revisions by one other user not shown) | |||
| Line 2: | Line 2: | ||
|- | |- | ||
|style="background-color: #EEE"|[[Image:owwnotebook_icon.png|128px]]<span style="font-size:22px;"> Project name</span> | |style="background-color: #EEE"|[[Image:owwnotebook_icon.png|128px]]<span style="font-size:22px;"> Project name</span> | ||
|style="background-color: #F2F2F2" align="center"| | |style="background-color: #F2F2F2" align="center"|[[File:Report.png|frameless|link={{#sub:{{FULLPAGENAME}}|0|-11}}]][[{{#sub:{{FULLPAGENAME}}|0|-11}}|Main project page]]<br />{{#if:{{#lnpreventry:{{FULLPAGENAME}}}}|[[File:Resultset_previous.png|frameless|link={{#lnpreventry:{{FULLPAGENAME}}}}]][[{{#lnpreventry:{{FULLPAGENAME}}}}{{!}}Previous entry]] }}{{#if:{{#lnnextentry:{{FULLPAGENAME}}}}|[[{{#lnnextentry:{{FULLPAGENAME}}}}{{!}}Next entry]][[File:Resultset_next.png|frameless|link={{#lnnextentry:{{FULLPAGENAME}}}}]]}} | ||
|- | |- | ||
| colspan="2"| | | colspan="2"| | ||
| Line 28: | Line 28: | ||
=Data= | =Data= | ||
The results for the Bradford Assay | <b>Figure 1:</b> The results for the Bradford Assay at 530nm | ||
[[Image:Nunziata_Bradford_Assay_Lysozyme_9_23.png|730px]] | [[Image:Nunziata_Bradford_Assay_Lysozyme_9_23.png|730px]] | ||
<b>Figure 2:</b> Calibration Curve at 600nm | |||
[[Image:Nunziata_Bradford_Calibration_Curve_9_23.png]] | [[Image:Nunziata_Bradford_Calibration_Curve_9_23.png]] | ||
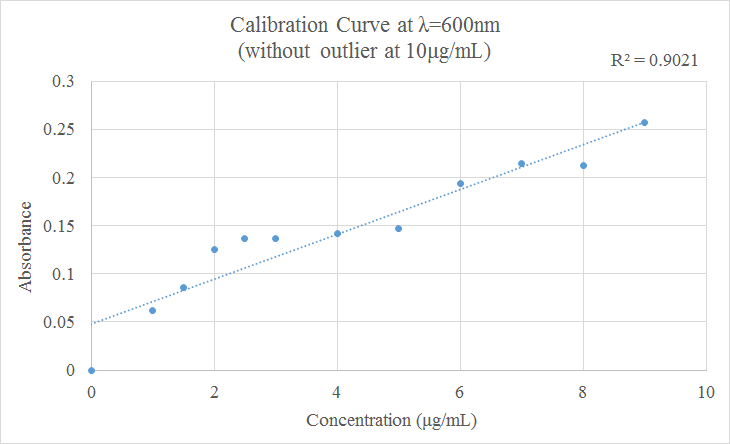
<b>Figure 3:</b> Calibration Curve at 600nm wiithout Outlier | |||
[[Image:Nunziata_Bradford_Calibration_Curve_without_Outlier_9_23.png]] | |||
Since the calibration curve shows 10µg/mL to be on outlier. Without that value, our R<sup>2</sup> value greatly increases | Since the calibration curve shows 10µg/mL to be on outlier. Without that value, our R<sup>2</sup> value greatly increases | ||
Overall, with the exception | Overall, with the exception of the outlier, our results fit the desired trend where the lower the concentration of lysozyme, the lower the absorbance value (and vice versa) | ||
<!-- ##### DO NOT edit below this line unless you know what you are doing. ##### --> | <!-- ##### DO NOT edit below this line unless you know what you are doing. ##### --> | ||
Latest revision as of 01:12, 27 September 2017
ObjectiveThe objective for today's lab work is to create variety lysozyme solutions from 1-10µg/mL and to analyze them using a Bradford assay in the UV Vis spectronomer
ProcedureWe loosely based our procedure this experiment from the one Dr. Hartings had in his lab notebook. First was creating a 5050µg/mL lysozyme solution by combining 0.1039g with 5mL of Tris buffer in a volumetric flask. Using the equation M1V1=M2V2, the amount Bradford Assay, lysozyme solution, protein assay reagent, and Tris buffer buffer needed for our various solutions. Those quantities can be found below:
DataFigure 1: The results for the Bradford Assay at 530nm
Figure 2: Calibration Curve at 600nm
Figure 3: Calibration Curve at 600nm wiithout Outlier Since the calibration curve shows 10µg/mL to be on outlier. Without that value, our R2 value greatly increases
Overall, with the exception of the outlier, our results fit the desired trend where the lower the concentration of lysozyme, the lower the absorbance value (and vice versa) | |


