User:Emma L. Niden/Notebook/Biology 210 at AU
Lab 6 Lab Manual Title: Embryology and Zebrafish Development February 18th- ongoing 2015
Purpose: observe from embryonic to adulthood, the affects of caffeine and how it relates to fish's movements if they are immersed in a caffeine solution. This information will be compared with a controlled, freshwater group of zebrafish.
Procedure: Each group looked at slides of different stages of an embryo of a starfish, frog, chick and read about a human’s. The group determined the different types of fertilization, amount of yolk, protection, and other characteristics to the organism such as larval stage and gastrulation. After comparing this information, a set of 20 zebrafish were collected for each control and experimental petri dish. An experiment was designed to illustrate how an environment can impact a Zebrafish’s embryo. This group is currently demonstrating caffeine's presence as a factor during the zebrafish’s embryonic growth. Throughout the data check in's, each member collected the designated information, as well as refreshing each environment's solution and feeding the fish.
Results: Routine check ups on Mondays, Wednesdays and Fridays for the fish. While we are there we try and identify the stages of development that the zebrafish currently are in. Data suggests that a caffeinated environment will stimulate the fish's bodies, causing uncontrolled shaking and reactions. Anatomical reasons are still unclear, due to the lack of heart visibility in many fish.
Figure 1: Day 6 of Control Zebrafish [[Image:IMG_1018.jpeg] http://openwetware.org/wiki/Image:IMG_1018.jpeg
Conclusion: Although there is not concrete qualitative data to support this the idea of caffeine increasing speed of the zebrafish, we did observe that the Zebrafish in the controlled environment were not as hyper as the fish exposed to the caffeine. To understand "hyper", I would describe it as having immediate reactions to disruptions in the environment, as well as having some meaningless changes of directions, or just shaking while remaining stationary. The Embryo's did not necacarily illustrate this concept of caffeine acting as a stimulant, however as the embryos developed into their larvae and grew their fins and internal structures, it became more clear that the different environments corresponded with the fish's movements. In addition to the actual speed of the fish, the mortality rate had a huge impact on the populations. The caffeinated fish seemed to die off very quickly, which in the end, removes some opportunity for more data for our hypothesis. The dosage could be altered to a lesser amount if we were to do this again.
Lab 5
Lab Manual Title: Invertebrates
2015
Purpose: To determine the Arthropoda classes from our transect’s Burlese funnel using the microscope. By furthuring our understnading of the physical structures we have identified, we can then piece together their evolution as invertabrates.
Procedure: Using the previously set up Burlese Funnel (emptied transect bag into a funnel, which is attached to a flask that contains a preservative of 25mL of ethanol/water solution) the group was able to observe and analyze through a microscope any living organisms. The physical structures led to correlating characteristics of major Arthropoda classes.
Results:
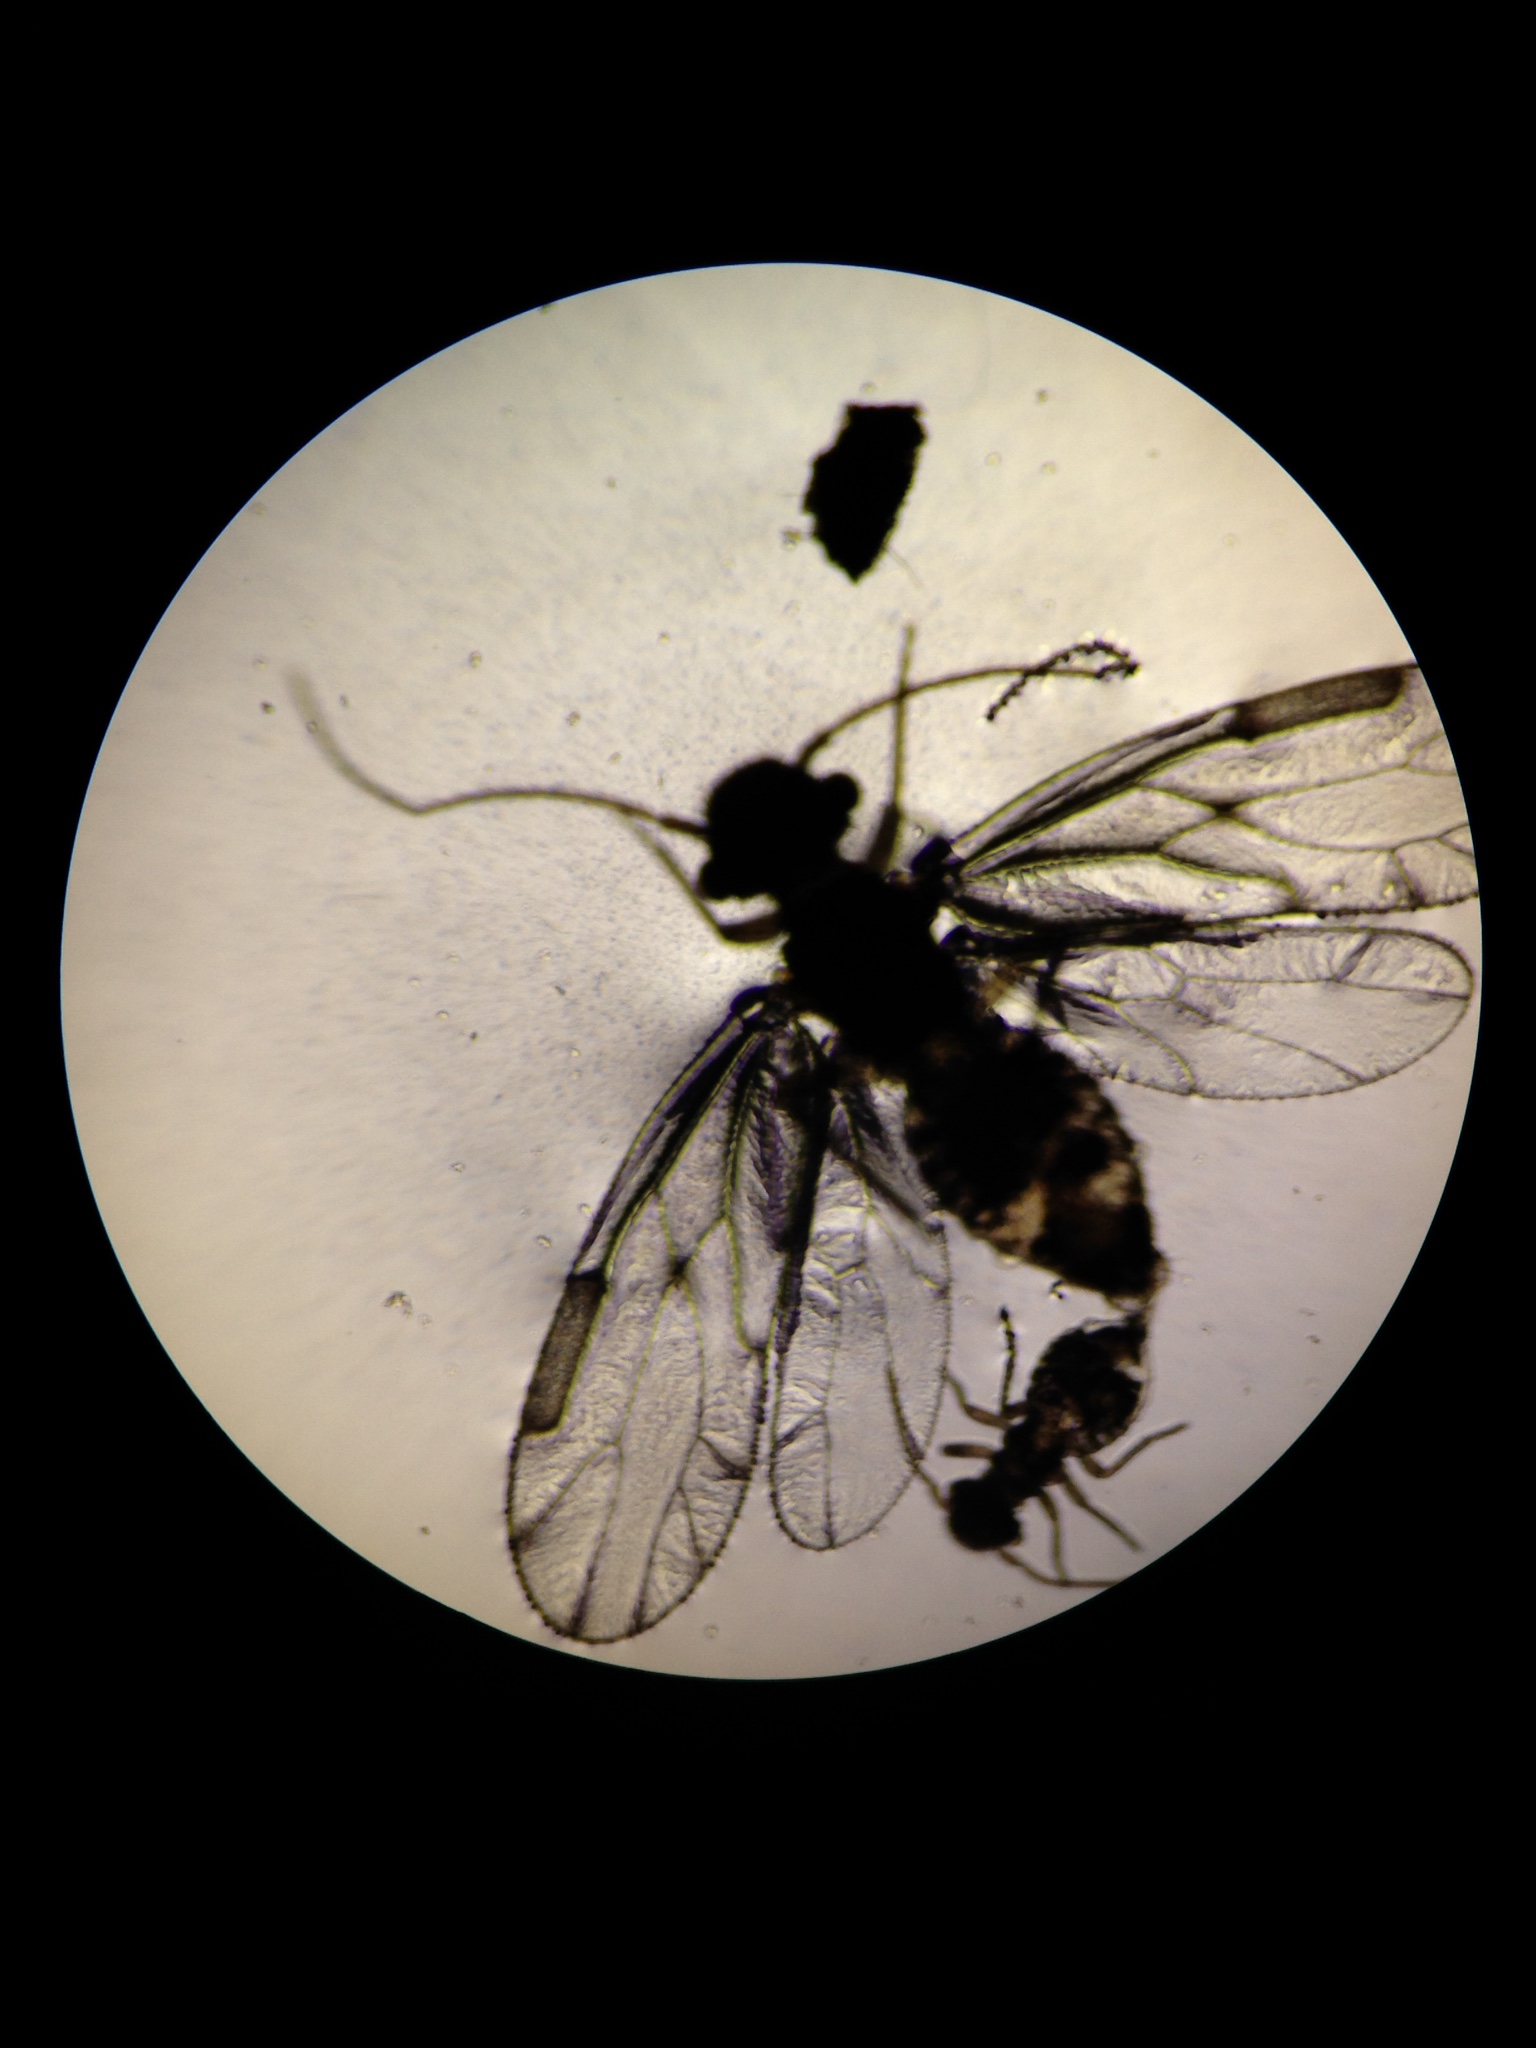
Table #1: Burlese Funnel Organism Type's [1]

Figure 1: Organisms
Conclusion: We can use physical characteristics and correlating characteristics to those physical characteristics to create an overall picture of what each organism is.
Lab 4 Lab Manual Title: Plantae and Fungi 2015
Purpose: Using our transects to develop our understandings of the diversity of plants and fungi. We will use characteristics such as vascularization type, specialized structures, methods of reproduction other traits to identify each organism's genus.
Procedure: Each lab group returned to their transect to collect a bag full of leaves, twigs and other plants to bring back to the lab, all while keeping track of where they came from in the environment. To determine vascularization we created a cross section of the leaves, and took their heights. While looking at the cross section, the group took note of any specialized structures that were present internally. Then to determine methods of reproduction, by looking at any seeds present and identifying its embryonic parts, as well as whether or not its a monocot or dicot.
Results:
Table#1: Transect's Leaf Differentiation [3]
[3]
Variation of leaf types within transect, however they all share similar qualities, such as having symmetrical leaves at one node (for most of the leafs surveyed).
Conclusion: Most of these leaves share similar characteristics. This may reflect the fact that they all came from the same environment, and therefore experience the same living conditions. These mechanisms for surviving in this environment suggests how form reflects function, and how different species may possess specific characteristics that are they share with their surroundings.
Lab #3 February 4, 2015 Lab Manual title: Microbiology and Identifying Bacteria with DNA Sequences
Intro: In this lab we are studything the characteristics of Baceria. This domain is so widely diverse, however certain methods can be used to determine certain groups of bacteria based off of gram stain results, shape and DNA sequence. We will be using our hay infusion agar cultures from the previous week to create slides and used in a PCR sequencing process. We also are able to determine bacteria’s susceptibility to antibiotics based off of a comparison between nutrient present plates and then nutrient, plus the antibiotic Tet (tetracycline).
Purpose: To determine visible characteristics of bacteria, as well as its DNA sequence to link together visible and non visible traits.
Table #1: 100 Fold serial dilutions results  [4]
[4]
The colonies of bacteria with the antibiotic were substantially less than the colonies solely on the nutrient agar plates. The results of this experiment did not have a clear correlation for the dilution value in relation to the agar type.
Table #2: Bacteria Characterization  [5]
[5]
PCR DNA Sequence for 16s Gene: 16S sequencing MB 15= >MB84-Rev_16S_G02.ab1 NNNNNNNNNNNNNNNNNNNNNNCATNNNNNCCNNGGTCACANTACNANNNGGGTTCCGGAATTCCTGGCTTGACGGGCGG TGTGTGCAAGGAACGGGAACGTATTCACCGCGCCATGGGTGATGCGCAATTACGATCGATTCCGACTTCAAAGAGTCGAG TTGCAGATTCCNATCGCAACTGAGACCGGCATTGGAGATATGCATCACATCTCCTNTGTANCTGCCCTCTGTACCGGCCA TTGTATTACGTGTGAGGNCCGAAGCCCAAGGGCCGTGATGATTTGACATCTTCCCCACCTTCCTCCCTCCTTGCGTATGC AGTCTCACTACACTCTACANCTTAAAGGTAGCAGCTAGTGACAGGGGTTGCGCTCGTGGCCGGACTTAACCTAACACCTC CAGGCACGAACTGACGACGACCATGCAGCACCTTGAAAATTGTCCGAATGAAGGTACAATTCCCAACCGATCATTTCCCA TTTAATCCTTGGTAAAGTGCNGCTCGNATCATTCAAGTAAACCCNATAANCCACCGCTTGTGCGGGCCTNCTTCAATTCC CTTGAATTTCATTCNNGCTAANGTACTCCCCACGTGGTTAACTTATCANTTTCTTTAAGTCTCTGATTCNNAANACCCAA AANNNATNNNNAACCNNTANACTGANTGNACTACCAGNNTNNCTNATCCTGTTCGCTCCCCACGCTNNCNNCCATCACCG TCANTTAAGACATACTANCCTGCCTTCGNNNATGGTGTTCTAANTAATATCTATGCATTTCACCGCTACACTACTTAGTC CNGCTACNTCTACCTTACTCAAGACCTGCANTATCAATGGGCAGTTTCACAGTTCAGCTGTGANATTTCACCACTGANTT ACANATCCGCCTACNGACCCNTTAAACNCAATATATCCNGANAACNCNTNNNNNNNCCGTATTACCNCNNCTGCTGNGCA CGGANTTNGNNNGTGCTTATTCNTATAGTACNTTCANCTTTCCNCANNTGGANCGGTTNATCCCTNATACAAANANNTTN ANNNCNNNTANNGCNGTCNNCCNTTCACGNNGGCATGGNTNNNTCAGGCTCTCATNCCATTGNTCCANNNTTCNTNNNTG NTGCCNNNNNNNNNAANNNNGGNNNNNNN mb16= >MB85-Rev_16S_H02.ab1 NNNNNNNNNNNNNNNNNNNNANNAGCTCCTGTTACGGTCACCGACTTCAGGTACCCCAGACTTCCATGGCTTGACGGGCG GTGTGTACAAGGCCCGGGAACGTATTCACCGCGCCATGGCTGATGCGCGATTACTAGCGATTCCAGCTTCATAGAGTCGA GTTGCAGACTCCAATCCGAACTGAGACCAGCTTTCGAGATTCGCATCCAGTCGCCTGGTAGCTGCCCTCTGTACTGGCCA TTGTATTACGTGTGTGGCCCAAGGCGTAAGGGCCGTGATGATTTGACGTCATCCCCACCTTCCTCTCTACTTGCGTAGGC AGTCTCACTAGAGTCCCCAACTGAATGATGGCAACTAGTGACAGGGGTTGCGCTCGTTGCAGGACTTAACCTAACACCTC ACGGCACGAGCTGACGACAACCATGCAGCACCTTGAAAAATGTCCGAAGAAAAGTCTATTTCTAAACCTGTCATTTCCCA TTTAAGCCTTGGTAAGGTTCCTCGCGTATCATCGAATTAAACCACATAATCCACCGCTTGTGCGGGCCCCCGTCAATTCC TTTGAGTTTCAGACTTGCGTCCGTACTCCCCAGGTGGCTAACTTATCACTTTCGCTTAGTCTCTGAAGCCAAGGCCCCAA AAACGAGTTAGCATCGTTTACGGCGTGGACTACCAGGGTATCTAATCCTGTTCGCTCCCCACGCTTTCGTCCATCAGCGT CAGTTGTTGCTTAGTAACCTGCCTTCGCAATTGGTGTTCTAAGTAATATCTATGCATTTCACCGCTACACTACTTATTCC AGCTACTTCAACAACACTCAAGACCTGCAGTATCAATGGCAGTTTCACAGTTGAGCTGTGAGATTTCACCACTGACTTAC AGATCCGCCTACGGACCCTTTAAACCCAATAAATNCCGGATAACGCTNCACCCTCCGTATTACCGCGGCTGCTGGCACGG AGTTAGNCNGTGCTTATTCGTATAGTACCTTCAGCTAGATACACGTANNNNNGTTTATCCCTATACAAANAAGTTTANNN CCATANGNNNTCGTCTTCANGCGGANGGCTGGATCNNNTCTNNCCCATNNNCCAATNNTCNCACTGCTGN.
Figure 1: DNA Sequence corresponding with Chryseobacterium.
 [6]
[6]
Conclusion: This information becomes useful for determining characteristics of the living forms from our hay infusion culture. These specimens illustrate qualities which we can analyze and correlate to a known species. Also using this information, we are able to further test our approximate species, by using a PCR. The PCR recognizes a DNA sequence which we are then able to match up using the BLAST.com database. This database gives us the species exact match up which we determined to be Chryseobacterium. Using many different tests, we were able to thoroughly identify living species organisms in our transect.
Lab #2
Lab Manual Title: "Identifying Algae and Protists"
January 26, 2015
Purpose: The purpose of this experiment was to explore the visible traits of an organism from our transect's Hay culture to determine its species.
Introduction: The dichotomous key helps scientists to come to conclusions about an organism's type based off of physical features that it displays. With the organism type known, they are then able to come to conclusions based off of other known organisms of that type, in order to give a larger perspective of that organism.
Procedure: Using the Hay infusion Culture prepared the week before from the sample of our trancesect, we observed the physical appearance as well as the scent of the jar. we also noted any new growths such as mold that formed on sides and on the thin film covering the top layer of water. To explore the microscopic life forms the group created slides from both the top layer of water, as well as the substances from the bottom of the jar. They looked at three different organisms from each layer, which they then used the dichotomies key in attempts to identify the species of each organism we found. The dichotomous key uses observations such as color, size, shape and other physical features/characteristics to outline points so that we can link together a suggested life form. For each organism we noted a few obvious features and then proceeded to follow along the key's questions.
Hay Infusion Culture
 [7]
[7]
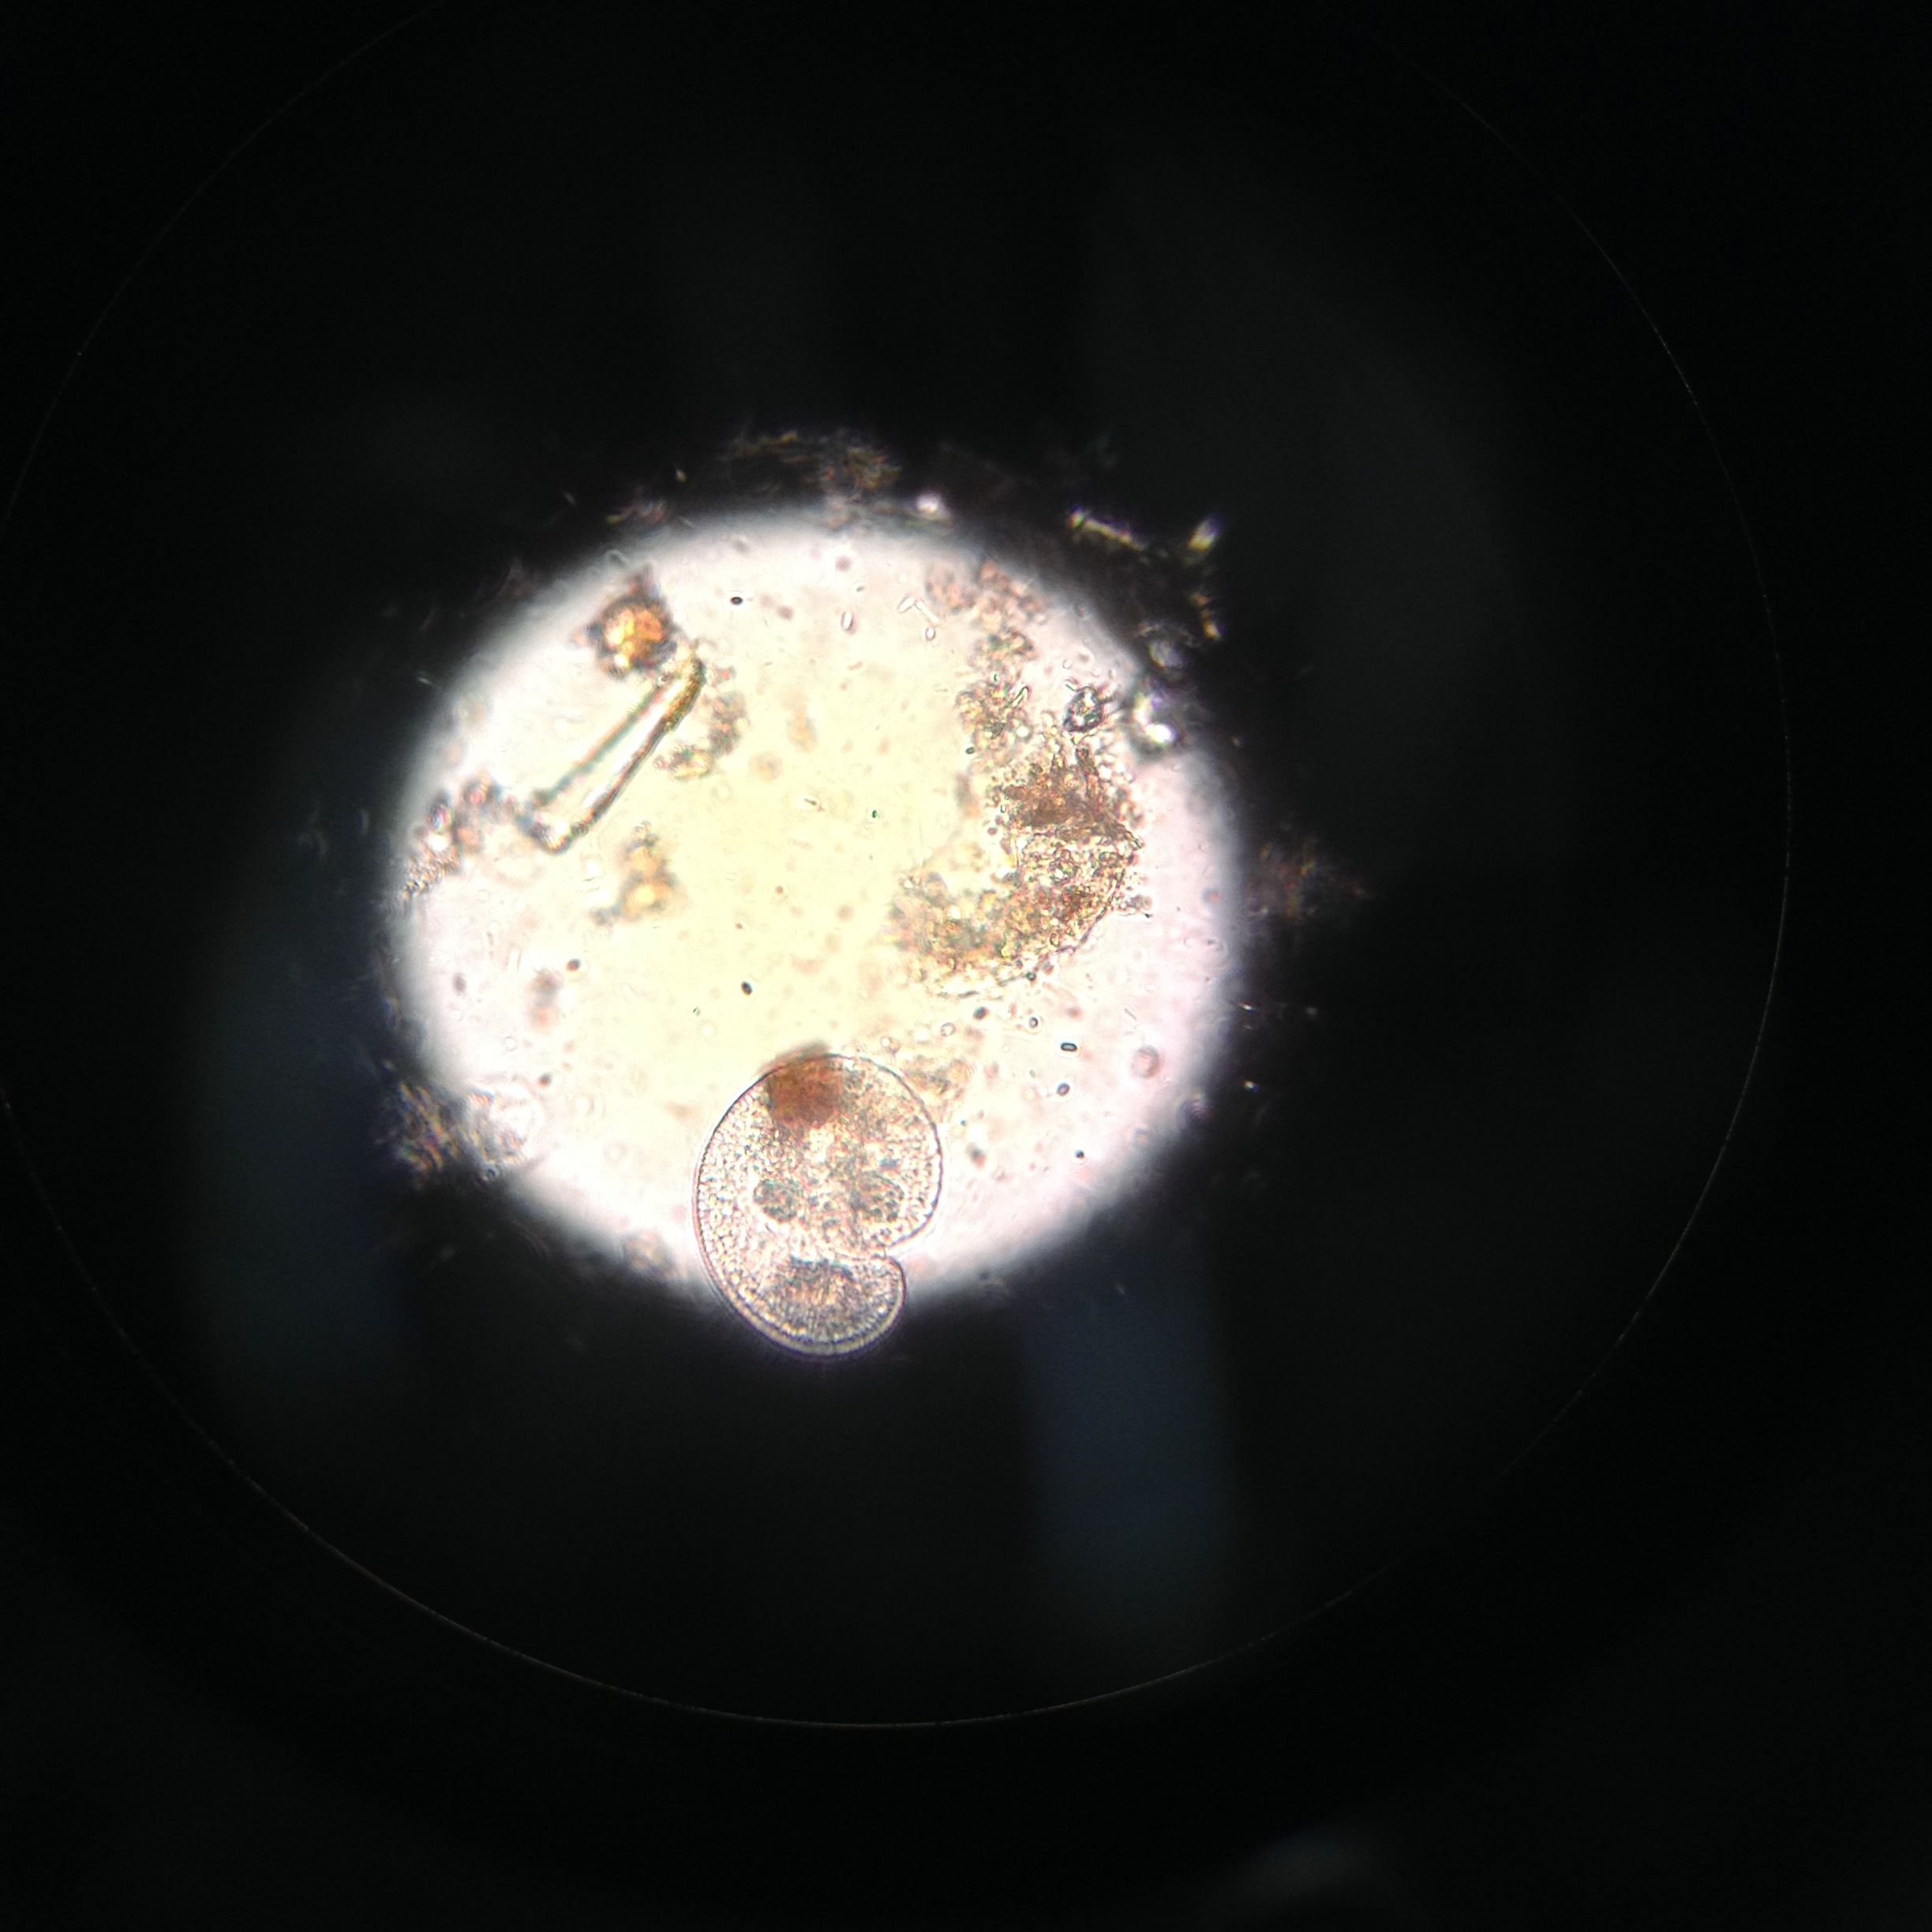
Organism #1

Organism #2
 [9]
[9]
Organism #3
 [10]
[10]
Figure 1: Bottom of Hay infusion Sample [[Image:IMG_0114.JPG ]] http://openwetware.org/wiki/Image:IMG_0114.JPG
Conclusion: The Hay infusion should preserve essential life forms we collected from our environment. This becomes our own little niche which will then be representative of our transects biodiversity.
Lab #1
Lab Manual Title: "Biological Life at AU"
January 26, 2015
Purpose: This lab introduces the concepts of an ecosystem and how abiotic and biotic factors coexist in a specific transect.
Introduction: A transect os a portion within an environment, consisting of both biotic and abiotic factors. This combination of living and non living creates a balanced ecosystem of organisms benefiting from its abiotic resources. Sometimes within an ecosystem the biotic components differ yet they are able to coexist either by benefitting from one another or living side by side.
Procedure: Groups observed their designated niche. The specific transect for our group was categorized as "Tall Bushes". Observations at the sight included a physical sample of both abiotic and biotic features of the environment, such as soil twigs, leaves, and rocks. A quick sketch was useful to refer to when mapping out the regions within the transect. Back in the lab, we created a Hay Infusion Culture of out transect's sample. This used, .1gm of dried milk and 500mL of water. We mixed all of this as well as at least 12g of our sample and then let the mixture sit for 1 week. The mixture will be used in the investigation of biotic factors from the transect.
Large Ariel Map (from Google Maps) which includes transect [11]

