User:Allison K. Alix/Notebook/Thesis Research/2013/07/25: Difference between revisions
| Line 43: | Line 43: | ||
x = 5.31uM | x = 5.31uM | ||
1800nM--> 33.9uL in 66.1uL PBS | 1800nM--> 33.9uL in 66.1uL PBS | ||
| Line 71: | Line 69: | ||
200nM--> 7uL in 93uL | 200nM--> 7uL in 93uL | ||
* excite at 417nm and run from 427-727 w/ 10nm slit width. Maximum peak @ ~490nm. | |||
==Fluorescence Measurements== | ==Fluorescence Measurements== | ||
Revision as of 12:12, 25 July 2013
| <html><img src="/images/9/94/Report.png" border="0" /></html> Main project page <html><img src="/images/c/c3/Resultset_previous.png" border="0" /></html>Previous entry<html> </html>Next entry<html><img src="/images/5/5c/Resultset_next.png" border="0" /></html> | |
To Do
Silica-Coating Part 11) Dilute 23.5nM AuNPs to 9.4nM (2mL AuNPs in 3mL water *NOTE: the water was left to assimilate to room temperature prior to dilution*) 2) Prepare 5mL 10mM MHA in water and isopropanol 3) Mix 5mL AuNPs w/ 5mL MHA 4) Stir overnight ThT/DNA attachment1) Prepare 100uL of the following concentrations of 4-strand and 8-strand telomeric DNA (which should generate 1 and 2 G-quadruplexes respectively) a) 100nM b) 300nM c) 500nM d) 700nM e) 900nM NOTE: Original Concentrations of 4 and 8-repeats are 265.6uM and 142.8uM, respectively 4-repeat x(500uL)=(265.6uM)(10) x = 5.31uM 1800nM--> 33.9uL in 66.1uL PBS 1400nM--> 26.4uL in 73.6uL 1000nM--> 18.8uL in 81.2uL 600nM--> 11.3uL in 88.7uL 200nM--> 3.8uL in 96.2uL 8-repeat 142.8uM(10uL) = (x)(500uL) x= 2.856uM 1800nM--> 63uL in 37uL PBS 1400nM--> 49uL in 51uL 1000nM--> 35uL in 65uL 600nM--> 21uL in 79uL 200nM--> 7uL in 93uL
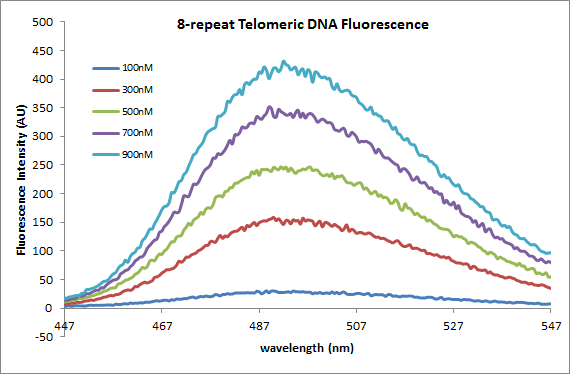
Fluorescence MeasurementsObservationsThe graphs above show the following: the fluorescence intensity of varying concentrations of 4-repeat telomeric DNA with 2.5uM ThT, the fluorescence intensity of varying concentrations of 8-repeat telomeric DNA (the same as the 4-repeat) with 2.5uM ThT, and a calibration curve displaying fluorescence intensity vs. concentration for the two different strands. From the calibration curve, two things are obvious: 1) there is an increase in fluorescence with an increase in DNA concentration independent of the the length of the strand (which we have seen before with the S-DNA strand) and 2) There is an increase in fluorescence when concentration is held constant and the number of telomeric repeats (TTAGGG) is increased. This is important as it is now evident that fluorescence can be measured to distinguish between amounts of DNA present as well as lengths of strands.
| |


