Physics307L:People/Franco/Final Report
Balmer Series Analysis and the Rydberg Constant
Author: Manuel Franco Jr.
Experimentalist: David Eduardo Sosa and Manuel Franco Jr.
Location: Albuquerque, New Mexico, 87131, United States
University of New Mexico Department of Physics and Astronomy
800 Yale Blvd. NE
E-mail: eMJeF_2004@hotmail.com
Abstract
SJK 01:05, 17 December 2008 (EST)

This abstract is improved upon the previous version...plus, for some reason I didn't know that H-1 was "protium!" The middle of your abstract is still out of place -- you are spending a lot of time in your abstract talking about stuff that would be in the theory part of your methods. If you're going to put values in your abstract, you should put your measured values, as that would be new to the reader.
In this experiment, we determined the Rydberg Constant, compared two hydrogen isotopes, and analyzed the Balmer series. In comparing the isotopes, we did this by using four wavelengths of two different hydrogen isotopes, protium and deuterium. We found that protium and deuterium have almost identical wavelengths. We also discovered they are different, in that deuterium has a heavier nucleus than protium, that is why there is a slight difference in their wavelengths. As for their Rydberg constants, protium's value is [math]\displaystyle{ RHydrogen = (Rinfinity)/(1+me/M)=1.09677286888108E+07 }[/math] and deuterium's value is [math]\displaystyle{ RDeuterium = (Rinfinity)/(1+me/M)=1.09647449477397E+07 }[/math]. As shown in the equations, the values varies on the mass of the isotope. As for Balmer series, we looked at the transitions of electrons from n ≥ 3 to n = 2. n is the radial quantum number. These colors reflect emissions of photons by electrons in excited states transitioning from higher states down to n=2. (1) We compared our experimental values to the accepted/actual values.
Introduction
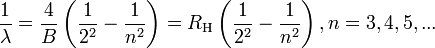
In 1885, Johann Jakob Balmer, a mathematician, discovered this series of colors of hydrogen in the color spectrum, hence the Balmer series. He derived such equation based on his observations: http://upload.wikimedia.org/math/1/2/2/1223c57e48b6b6c0cf038dd69a22db64.png [1]
Three years after the discover of this series, Johannes Robert Rydberg, a physicist, would revise the equation and analyze the details of this phenomena. He would revise the equation to what we commonly known today: http://upload.wikimedia.org/math/0/a/c/0acd60cdab573b571c1a07ee23a8c0d7.png
He used this formula to predict the wavelengths of photons that were emitted by changes in the energy level of an electron in an atom. (5) From his research, would structure the periodic table.
The way we went about measuring the Rydberg constant, is we took different hydrogen isotopes and looked at the wavelengths that emitted the brightest color, and solved for the slope based on those measurements from this empirically derived formula [math]\displaystyle{ \frac{1}{\lambda_{\mathrm{vac}}} = R_{\mathrm{H}} \left(\frac{1}{n_1^2}-\frac{1}{n_2^2}\right) }[/math]. This is the Rydberg for the mass an infinite nucleus relative to an electron [math]\displaystyle{ R_\infty = \frac{m_e e^4}{8 \epsilon_0^2 h^3 c} = 1.0973731568525(73) \times 10^7 \,\mathrm{m}^{-1} }[/math](5). Since we're dealing with different isotopes, we will use: [math]\displaystyle{ R_M = \frac{R_\infty}{1+m_e/M} \ }[/math]. Below in the data anaylsis, we have obtianed the individual Rydberg constants for hydrogen and deuterium.
The constants are as follows for these equations:
[math]\displaystyle{ h \ }[/math] is the Planck's constant,
[math]\displaystyle{ m_e \ }[/math] is the rest mass of the electron,
[math]\displaystyle{ e \ }[/math] is the elementary charge,
[math]\displaystyle{ c \ }[/math] is the speed of light in vacuum, and
[math]\displaystyle{ \epsilon_0 \ }[/math] is the permittivity of free space. (6)
Our measurements were slightly inconsistent with the accepted value. We could improve these in future measurements by maybe either up grading the technology, and/or the method on how we go about obtaining these values.
Method and Materials
Equipment
We used a constant deviation spectrometer with a Pellin-Broca constant-deviation prism [2], a spectrum tube power supply [3], and 3 spectral line tubes of three different elements: Hydrogen, Deuterium, Mercury. Details of the materials used are in links. We made sure that all the instruments were functioning correctly. We then plugged in the power supply, and inserted the Hg tube as instructed by the manual. We turned on the apparatus and allow it to heat for about a minute or so. Below are some pictures of the equipment:
-

Picture 1: This is the Pellin-Broca constant-deviation prism.
-

Picture 2: This is the dial that measured the wavelength.
-

Picture 3: To the right is the spectrometer, and to the left of it is the tube power supply.


Calibration
After setting up the equipment, we started off by calibrating the spectrometer by using mercury (Hg) spectral line tube, and a table of the spectral lines of Hg given by the lab manual (Lab Manual: Section 4.3).
Hg Spectral Lines
| Color | Wavelengths |
|---|---|
| Deep Violet | 404.7 nm (hard to see) |
| Violet | 435.8 nm |
| Blue-Green | Skipped (very weak) |
| Green | 546.1 nm |
| Yellow | 577.04 nm |
| Yellow | 579.0 nm |
| Red | 690.75 nm |
We set the dial one of the wavelengths in the above table. We used the color green, because our data would deviate based on our initial calibration. Since green is centric, it would minimize instrumental data error. We used the other colors to confirm that it was properly calibrated. We aligned the colors using the cross hairs in the eyepiece, and adjusted the prism to align the cross hairs with the color as need. Once we calibrated the spectrometer, we adjusted the slit at the other end of the it to .7 mm. We adjusted the slit as we saw fit later on, but we stayed within the bounds of .5 and 1 mm. If the slit was narrow, the color had a higher resolution. But if the slit is wider, the color was somewhat blurred. As we were calibrating, Koch mention to us that the gears in the dial have what is called backlash. So when the spectrometer was calibrated, we turn it going clockwise. We took measurements clockwise at all times. If we were to take a data point clockwise, or opposite to direction we initially used to calibrate, our data would be off by about 1 nm. We took all measurements by approaching the spectral line turning the dial clockwise to eliminate problems from backlash.
Hydrogen Spectrum Tube
After we calibrated and reduced backlash, we turned the power supply off. Then we change the Hg tube with the H tube. An important note is that the bulbs get very hot and caution is necessary when changing bulbs to avoid burns. We turned the power supply back on. We will now record the wavelengths seen through the eye piece based on the Hydrogen. There are four bright and distinct lines: red, turquoise, bright violet, and a diminished violet. We saw something similar to Figure 1.

Deuterium Spectrum Tube
After taking several measurements of the wavelength from hydrogen, we repeat the process of replacing the test tubes. This time we took measurements from deuterium. The same colors appear as in hydrogen, and the wavelengths are about the same.
Measurements and Data Analysis


Wavelengths of H and D
The following measurements are the wavelengths for hydrogen and deuterium. The data was taken clockwise.
Table 1: Measurements of Spectral Line Wavelengths for Hydrogen
| Color | Trail 1 (nm) | Trail 2 (nm) | Trail 3 (nm) | Trail 4 (nm) | Trail 5 (nm) |
|---|---|---|---|---|---|
| Red | 656.3 | 656.1 | 655.0 | 656.0 | 655.0 |
| Turquoise | 485.5 | 485.75 | 485.25 | 485.1 | 485.75 |
| Violet | 434.5 | 433.25 | 434.25 | 433.25 | 343.0 |
| Dim. Violet | 410.5 | 410.0 | 410.3 | 410.0 | 410.0 |
Table 2: Measurements of Spectral Line Wavelengths for Deuterium
| Color | Trail 1 (nm) | Trail 2 (nm) | Trail 3 (nm) | Trail 4 (nm) | Trail 5 (nm) |
|---|---|---|---|---|---|
| Red | 655.0 | 655.0 | 655.25 | 654.9 | 655.5 |
| Turquoise | 485.6 | 485.5 | 485.0 | 485.1 | 484.9 |
| Violet | 434.0 | 433.75 | 433.5 | 433.8 | 433.25 |
| Dim. Violet | 409.9 | 409.8 | 409.9 | 409.9 | 410.0 |
The following table shows the colors of each wavelength, their means, and their uncertainties. This is the excel sheet 1 in where I did all my data analysis to find the wavelengths of each color of hydrogen and deuterium. See Table 3 in Results and Discussion for the final results.
The Rydberg Constant
- Rydberg Constant for Hydrogen
[math]\displaystyle{ RHydrogen = (Rinfinity)/(1+me/M)=1.09677286888108E+07 }[/math]
- Rydberg Constant for Deuterium
[math]\displaystyle{ RDeuterium = (Rinfinity)/(1+me/M)=1.09647449477397E+07 }[/math]
These values were obtained from Jessy Smith's excel sheet. I used these values in my data analysis.
As for the Rydberg constants, I did my data analysis in this word excel sheet 2, and I obtained graphs for hydrogen and deuterium. See Graphs 1-4.
I used the following equation, to find the slope, which in turn gives the Rydberg constant. I went through and calculated the individual slopes of each wavelength of hydrogen and deuterium, and compared them to the actual values.
http://upload.wikimedia.org/math/5/a/0/5a05645dc256a0aca0ab1c9cf97b6525.png Wikipedia: Balmer Series
Results and Discussion


Final Results
Table 3: Best Guess for the Wavelengths of Hydrogen and Deuterium
| Color | Wavelengths for H (nm) | Wavelengths for D (nm) | Accepted Values for H and D |
|---|---|---|---|
| Red | 655.68 +/- .28 | 655.13 +/- .11 | 656.3 nm |
| Turquoise | 485.47 +/- .13 | 485.22 +/- .14 | 486.1 nm |
| Violet | 433.85 +/- .26 | 433.66 +/- .13 | 434.1 nm |
| Dim. Violet | 410.16 +/- .11 | 409.90 +/- .03 | 410.2 nm |
Here are my results for the calculated Rydberg constants.
- Best guess for H: [math]\displaystyle{ 1.095(.002) X 10^7 m^-1 }[/math]
- Actual value for H: [math]\displaystyle{ 1.09677286888108 X 10^7 m^-1 }[/math]
- Percent Difference: 0.089%
- Best guess for D: [math]\displaystyle{ 1.0959(.0017) X 10^7 m^-1 }[/math]
- Actual value for D: [math]\displaystyle{ 1.09647449477397 X 10^7 m^-1 }[/math]
- Percent Difference: 0.054%
Discussion
Concerning Table 3, some of my measurements are with in the 60% confidence interval (σ), such as violet and dim. violet for hydrogen. But as for other measurements, such as red in both H and D, the number is off to about 3σ. Most of these measurements have systematic error.
Now as for the final results for the Rydberg constants, the actual value for hydrogen is [math]\displaystyle{ 1.09677286888108X10^7m^−1 }[/math], and the experimental is [math]\displaystyle{ 1.095(.002)X10^7m^−1 }[/math]. This value is within the 60% confidence interval. This is a good value, and is very close to the actual values. For deuterium, the actual value for hydrogen is [math]\displaystyle{ 1.0959(.0017) X 10^7 m^-1 }[/math], and the experimental is [math]\displaystyle{ 1.09647449477397 X 10^7 m^-1 }[/math]. This value is also, within the 60% confidence interval. This is a very good value just like hydrogen. Thus we can conclude that since hydrogen(protium) and deuterium are different isotopes of hydrogen, they have different mass, different Rydberg constants, and different wavelengths. See Graphs 1 & 2 for how these vales were determined.
For Graphs 3 & 4, these graphs compare the quantum number transitions and their individual Rydberg constants for H and D. In both of these graphs, dim. violet's Rydberg constant is the first to over lap the actual value of the given isotope. The deviation is a fixed deviation, and it is based on the first Rydberg constant to overlap the actual value. The devation is hydrogen is .0005 nm, and deuterium is .0015 nm. This means that hydrogen is much more closer to the actual value than deuterium.
Improvements
Concerning taking measurements from the spectrometer, we took measurements as best as we could, and within the best of our instrumental ability. We reduced backlash, and reduced the light in the room. I think more values of the wavelengths could improve the values for Table 3. Maybe 8-10 measurements, instead of five. Also, when taking the measurements, would change the resolution as I take measurements. For example, start off with a wide slit, and take your final measurement with a narrow slit, but not to narrow were nothing is visible in the eyepiece.
Conclusions
Having done all the data and research, we can conclude that there is a distinct difference in the different isotopes of hydrogen. Even in tritium even though, we did not deal with tritium, just simply in the isotopes we worked with protium and deuterium. We can also say that for sure, they emit the same colors roughly at the same wavelength depending on their mass. As for the Rydberg constant, this constant can help in finding other transitions of any hydrogen isotope, such as from n=9 to n=2. This specific transition is ultraviolet, and can be calculated using the constant. Concerning other projects similar to this, other scientists are progressing this area in physics and have much more advanced methods and technology than the ones used in this experiment. Such as hyperfine structure. Advancements in this field can help us understand more at the quantum level, and learn more about the atomic/sub-atomic levels of the atom. Maybe even advance in the field of particle/matter interaction. Here is a link to a group of researchers who have taken this experiment to a higher precision and anaylsis.
References
- C.R. Nave (2006). Georgia State University, HyperPhysics: Hydrogen Energies and Spectrum
- Physics 307L: Lab Manual, Professor Micheal Gold, (2006), Lab Manual: Sections 4.1-4.6
- Jessy Smith, October 2007. University of New Mexico: Physics and Astronomy, Balmer Series Lab
- Various Authors, Wikipedia article on Balmer Series
- Committee on Data for Science and Technology (CODATA), CODATA Recommended Values of the Fundamental Physical Constants: 2006.
- Various Authors, Wikipedia article on Rydberg Constant
Acknowledgments
I want acknowledge Dr.Koch and Aram for taking the time to instruct us, and also in showing us how to go about this and other experiments. I want to thank the department of physics and astronomy, a.k.a. PandA, for providing the materials for this experiment. I would also like to acknowledge David E. Sosa for assisting me in this experiment. I would like to thank the students from last years class. They were on the forefront of all the experiments for junior lab. Their experiments helped improve ours.