IGEM:IMPERIAL/2009/M0/Assays/1.3
Determining concentration of IPTG
Aims
- Characterise Lac promoter
- Determine the IPTG concentration that allows for maximal protein production while still being non-toxic to the cell
- Roughly estimate the time duration it takes before GFP expression (M2 activation)
Assay
The cells will be grown until OD=0.7. Now, IPTG of various concentrations will be added, and the RFP output will be measured.
The experiment will generate OD and fluoresence data for RFP
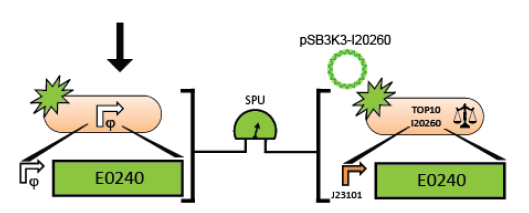
OD and fluorescence data for GFP which can be converted in Specific Promoter Units (SPUs) by a calculator found on the Registry of Standard Biological Parts.
The secondary carbon source will be taken from the previous experiment (see Secondary carbon source selection for CRP promoter)
The glucose concentration will be taken from commercial autoinduction media (0.05%) although this might have to be modified to be used at 28°C
Equipment
Measurement phase
- Spectrophotometer
- Fluorimeter
- 96 well plates
Reagents
Assembly phase
- Miniprep reagents
- Ligation reagents
- Transformation reagents
Media
M9 Minimal Media
Disodium Phosphate (12.0g)
Potassium dihydrogen phosphate (6.0g)
Sodium Chloride (1.0g)
Ammonium Chloride (2.0g)
Magnesium Sulphate (0.75g)
Glycerol (5.0g per L)= 54.39uM 0.5%
Glucose (0.5g per L) = 2.78mM 0.05% per 100ml
Secondary carbon source of choice (5g per L) 0.5% per 100ml
Protocol
M9 Minimal Media Background:
Minimal M9 media is a defined minimal growth media suited to optical density based studies on account of its low absorbance and autofluoresence.
MgSO4 solution precipitates when heated and therefore cannot be autoclaved. To maintain sterility, MgSO4 solution should be filter sterilised (Minisart® 0.20µm syringe filter) and added after the other chemicals had been dissolved, mixed and autoclaved. To support bacterial growth, M9 medium requires the addition of a carbon source.
M9 Minimal Media Preparation:
- Measure out the following reagents and dissolve them in 1000ml of sterile H20:
Disodium Phosphate = 6.0g
Potassium dihydrogen phosphate = 3.0g
Sodium Chloride = 0.5g
Ammonium Chloride = 1.0g
Glycerol (5.0g per L)= 54.39uM
Secondary carbon source of choice (5g per L)
Glucose (0.5g per L) = 2.78mM
- Repeat the step above such that a total of 2000ml of M9 minimal media is prepared.
IPTG standard solution Preparation:
- 1g of IPTG dissolved in 40ml of dH2O (filter sterilize) to get 0.1M IPTG
Glass-ware Preparation:
- 7 conical flasks
Other Protocols Needed
- Miniprep
- Ligation
- Transformation
Assembly Instructions
1. Prepare the test promoter by miniprep of colonies containing promoter test construct followed by restriction digest with Xbal and PstI.(see miniprep protocol)
2. Prepare the GFP reporter device (BBa_E0240) by miniprep of miniprep of colonies containing E0240 followed by restriction digest with Xbal and PstI.
3. Prepare backbone plasmid (pSB3K3) by preparative PCR of pSB3K3-P1010 using primers BBa_G1000 and BBa_G1001 followed by restriction digest with EcoRI and PstI.
4. Combine the test promoter, GFP reporter device, and backbone plasmid in a 3-way ligation to build the promoter test construct. (see ligation protocol)
5. Prepare empty backbone vectors.
5. Transform the promoter test construct and empty vectors into TOP10 cells. Select for transformants on Kanamycin plates. Optimum DNA for each component could be approximately 10ng per microlitre.(see transformation protocol)
6. Measure the activity of the test promoter using the measurement instructions.
Promoter Measurement Protocol
1. Inoculate single colonies of E. coli cells into eppendorf tubes containing 1 ml of the pre-warmed (28°C) normal supplemented M9 medium with kanamycin (20 ug/ml). There will be 2 eppendorf tubes, one for cells containing the promoter test construct on the vector backbone, the other for control cells which are transformed with an empty vector.
2. Grow the cultures in the eppendorf tubes for approximately 6 hrs at 28°C with spinning at 70 rpm.
3. Dilute the cultures 1:100 into 100 ml of fresh media and grow the cultures
4. Use an automatic plate reader to detect the time at which the culture reaches an OD of 0.7.
5. In the meantime, create 7 conical flask setups
Flask 1: 0 mM IPTG
Flask 2: 0.1mM IPTG
Flask 3: 0.3mM IPTG
Flask 4: 0.6mM IPTG
Flask 5: 1.0mM IPTG
Flask 6: 1.3mM IPTG
Flask 7: 1.6mM IPTG
6. After the OD reaches 0.7, add 0, 10, 30, 60, 100, 130, 160 ul of 0.1M IPTG to 10ml of culture into each conical flask setup and mix well.
7. Transfer 200 ul aliquots from each culture into a flat-bottomed 96 well plate (Cellstar Uclear bottom, Greiner). For ease of measurement.
7. Incubate the plate in a multi-well fluorimeter (Perkin Elmer) at 28°C and assay with an automatically repeating protocol of absorbance measurements (600 nm absorbance filter, 0.1 second counting time through 5 mm of fluid), fluorescence measurements (Excitation peak: 584 nm Emission peak: 607 nm, 0.1 seconds, CW lamp energy 12901 units), and shaking (3 mm, linear, normal speed, 15 seconds). (Just measures GFP – fluorescence over time).
8. Repeat the absorbance and fluorescence measurements every half an hour during mid-exponential growth for about 5 hours, and hourly until GFP starts being produced.
8. Determine background absorbance by measuring wells containing only media. This should be subtracted from subsequent absorbance readings.(Blank).
9. Determine background fluorescence at different ODs from the fluorescence of control cells without a GFP expressing vector. (This is from the culture containing the untransformed cells). (Control)


