Endy:Victor3 absorbance labels: Difference between revisions
| (2 intermediate revisions by one other user not shown) | |||
| Line 2: | Line 2: | ||
==Background== | ==Background== | ||
The [[Endy:Victor3 plate reader|Victor3 plate reader]] can measure absorbance at 600nm. Rather than attempting to measure the path length we convert absorbance to Optical Density (OD) units via calibration with our [[Endy:Portable spec|portable spec]]. Absorbance measurements are taken using a photometry label. There are a number of label parameters that can be varied. It was of interest to see whether measurement linearity or signal to noise ratios could be improved by | The [[Endy:Victor3 plate reader|Victor3 plate reader]] can measure absorbance at 600nm. Rather than attempting to measure the path length we convert absorbance to Optical Density (OD) units via calibration with our [[Endy:Portable spec|portable spec]]. Absorbance measurements are taken using a photometry label. There are a number of label parameters that can be varied. It was of interest to see whether measurement linearity or signal to noise ratios could be improved by changing these parameters. | ||
==Test Labels== | ==Test Labels== | ||
| Line 13: | Line 13: | ||
Measurements were taken in duplicate and repeated using the [[Endy:Portable spec|portable spec]]. It was found that altering the counting time had no effect on either signal strength or linearity. Using a large emission aperature reduced signal to noise ratios whereas the small and normal aperatures had equivalent signal to noise ratios. The linearity for small and normal aperatures was identical, an increased counting time also had no effect. | Measurements were taken in duplicate and repeated using the [[Endy:Portable spec|portable spec]]. It was found that altering the counting time had no effect on either signal strength or linearity. Using a large emission aperature reduced signal to noise ratios whereas the small and normal aperatures had equivalent signal to noise ratios. The linearity for small and normal aperatures was identical, an increased counting time also had no effect. | ||
The data shown below shows that both instruments give slightly non linear readings over the range of OD's tested. For the plate reader, data is only shown for the Normal emission aperature. | The data shown below shows that both instruments give slightly non linear readings over the range of OD's tested. For the plate reader, data is only shown for the Normal emission aperature. Absorbance readings from the plate reader have been corrected by subtracting a media blank. Hence, these calibration curves should be independent of the media used. | ||
[[Image:TableSpec to Plate Reader.png|thumb|left|Instrument reading for a serial dilution of cell culture]] | [[Image:TableSpec to Plate Reader.png|thumb|left|Instrument reading for a serial dilution of cell culture]] | ||
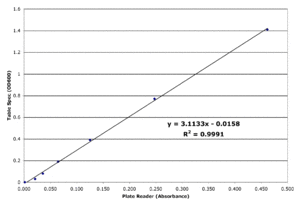
[[Image: | [[Image:Victor3AbsorbanceCalibration.gif|thumb|left|Calibration of Plate Reader Absorbance to Table Spec OD]] | ||
Latest revision as of 09:17, 11 December 2007
Also see: Victor3 plate reader
Background
The Victor3 plate reader can measure absorbance at 600nm. Rather than attempting to measure the path length we convert absorbance to Optical Density (OD) units via calibration with our portable spec. Absorbance measurements are taken using a photometry label. There are a number of label parameters that can be varied. It was of interest to see whether measurement linearity or signal to noise ratios could be improved by changing these parameters.
Test Labels
Photometry labels were created using the 600nm excitation filter. Small, normal and large emission aperatures were used and the counting time was examined at both 0.1s and 0.5s.
Test Samples
A culture of I7101.pSB4A3.MG1655 was serially diluted by a factors of 2 from 1:1 to 1:32.
Measurements
Measurements were taken in duplicate and repeated using the portable spec. It was found that altering the counting time had no effect on either signal strength or linearity. Using a large emission aperature reduced signal to noise ratios whereas the small and normal aperatures had equivalent signal to noise ratios. The linearity for small and normal aperatures was identical, an increased counting time also had no effect.
The data shown below shows that both instruments give slightly non linear readings over the range of OD's tested. For the plate reader, data is only shown for the Normal emission aperature. Absorbance readings from the plate reader have been corrected by subtracting a media blank. Hence, these calibration curves should be independent of the media used.

