ColinWikholm BIOL368 Week 4: Difference between revisions
From OpenWetWare
Jump to navigationJump to search
(→Activity 2: Part 2: more specific title) |
(Colin Wikholm fixed errors created during website crash) |
||
| (37 intermediate revisions by the same user not shown) | |||
| Line 4: | Line 4: | ||
===Methods and Results=== | ===Methods and Results=== | ||
====Activity 2, Part 1: Looking at Clustering Across Subjects==== | ====Activity 2, Part 1: Looking at Clustering Across Subjects==== | ||
#Upload the files “visit_1_S1_S9.txt” and “visit_1_S10_S15.txt” into the ''Biology Workbench'' nucleic acid tools | |||
#Generate a multiple sequence alignment and genetic tree using 3 clones from each subject (12 total): | |||
#*[[Image:WEEK4 23367.CLUSTALW.dt.jpg|600x600px]] | |||
#Record the analyzed data in Table 2 (provided): | |||
#*[[Image:Sequence table.png]] | |||
#Using the tree you generated, perform/aswer the following: | |||
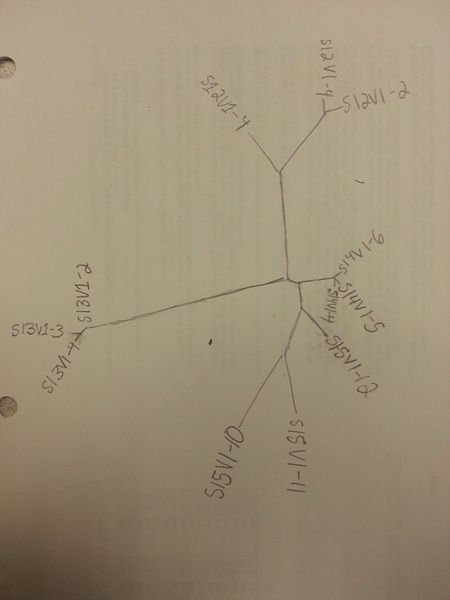
#*Draw the tree by hand onto a piece of paper for note-taking: | |||
#*[[Image:20160926 190939.jpg|600x600px]] | |||
#*Do the clones of each subject appear clustered? | |||
#**'''Yes: Each of the clones are clustered together within their respective subjects. In addition, the clones of subjects 14 and 15 also appear to be clustered together.''' | |||
#*Do some subjects have higher clone diversity than others? | |||
#**'''Yes: Some clones of each subject are closer on the tree than others. For example, subject 14's clones have considerably less genetic diversity than subject 15 (subject 14 clones are much closer to each other on the tree)''' | |||
#*Do any subjects appear in clusters? | |||
#**'''Yes: Subjects 13 and 14 appear in clusters. Subjects 15 and 12 are not as closely clustered and occupy a more loosely conjoined space, but are still relatively clustered. Subject 15, clone 12 is a notable exception and is nearly as closely related to the subject 14 clones as to the other subject 15 clones.''' | |||
#*Describe your tree. Interpret clustering patterns and how they reflect the evolutionary relationships of the subjects' HIV sequences. | |||
#**'''Subjects 14 and 15 have relatively closely related clones. Subjects 12 and 13 have much more distantly related clones compared to the other viruses. Overall, the tree describes 4 different genetically-tied clusters of viruses derived from their respective subjects. In general, clones from the same patient are more closely related to each other, and the genetic diversity within each cluster varies. This suggests that virus clones in each patient evolved from a common ancestor within their subject, although the rate of evolution varies from subject to subject.''' | |||
#*Copy-paste your tree into Word, print it, and share it with the class. | |||
#**'''See trees above''' | |||
====Activity 2, Part 2: Quantifying Diversity Within and Between Subjects==== | ====Activity 2, Part 2: Quantifying Diversity Within and Between Subjects==== | ||
''(The answers to the following steps can be found in Table 3)'' | |||
#Choose one subject and select align all of his or her clones. | |||
#Calculate the S statistic by counting the number of positions with one or more nucleotide difference across the sequences. | |||
#Enter the results of step 2 into Table 3. | |||
#Import the alignment for later use. | |||
#Repeat the analysis for two more subjects. | |||
#Calculate theta for the same three subjects using the following formula: | |||
#*[[Image:Screen Shot 2016-09-26 at 3.40.18 PM.png|left|200x200px]] | |||
#* | |||
#* | |||
#* | |||
#* | |||
#* | |||
#*For sample size N=5, you would calculate the following: 1+1/2+1/3+1/4+1/5 = 25/12 | |||
#Instead of manually finding minimum and maximum pairwise distances, find this using the computer starting by using the Clustdist alignment tool to create the distance matrix of your saved alignment | |||
#Convert the highest and lowest pairwise scores and convert percentages to raw scores (multiple the percentage by the length of the sequence. In most cases, this will be 285) | |||
#Round to integers, record results in Table 3, and repeat the process for the 2 remaining subjects | |||
#*[[Image:Theta table and other stuf.png]] | |||
#To look at the maximum and minimum differences across subjects, start by creating a new alignment with all the sequences of two subjects | |||
#Use Clustdist to create a pairwise distance matrix for the alignment. Find the minimum and maximum differences across the subject sequences. | |||
#Record results in Table 4 and repeat the process across the other pairs. | |||
#Post results of the analysis so that other people may use it while working on Activity 3 | |||
#*[[Image:AcrossPairs.png]] | |||
===Data and Files=== | ===Data and Files=== | ||
*[[Media:Data in tables.xlsx|Data Tables]] | |||
*[[Media:Visit_1_Subjects_1_thru_9_HIV.txt]] | |||
*[[Media:Visit_1_Subjects_10_thru_15_HIV.txt]] | |||
===Scientific Conclusion=== | ===Scientific Conclusion=== | ||
| Line 13: | Line 57: | ||
==Defining Your Research Project== | ==Defining Your Research Project== | ||
#What is your question? | #What is your question? | ||
#*'''Would the results of Markham et al. be different statistical methods were utilized? Specifically, would using correlation analysis of CD4 T cell decline vs. HIV genetic divergence show a different relationship than the grouping used in the Markham et al. study? | |||
#Make a prediction (hypothesis) about the answer to your question before you begin your analysis. | #Make a prediction (hypothesis) about the answer to your question before you begin your analysis. | ||
#*'''I predict that CD4 T cell decline will correlate significantly and positively with HIV genetic divergence. Consequently, the analysis have the same implications of the Markham et al. study.''' | |||
#Which subjects, visits, and clones will you use to answer your question? | #Which subjects, visits, and clones will you use to answer your question? | ||
#* | #*Justify why you chose the subjects, visits, and clones you did. | ||
#*''' | #**'''We chose to utilize the four subjects with the greatest number of data points (subjects 6, 8, 9, 14) in order reduce uncertainty while minimizes excess number of subjects. Because of this, we will also utilize all of the subject visits and all the clones for each subject. | ||
==Acknowledgments== | ==Acknowledgments== | ||
I worked with my group member, [[User:William P Fuchs|Will Fuchs ]] in-class during week 4 to plan our HIV project. We shared ideas during the period, and came to an agreement on our project together. I also worked with [[User:Anindita Varshneya|Anindita Varshneya]] and [[User:Mia Huddleston|Mia Huddleston]] in-class to exchange ideas and decide on our group projects. I also took the references and adapted general assignment instructions from the [[BIOL368/F16:Week 4]] page. While I worked with the people noted above, this individual journal entry was completed by me and not copied from another source. | |||
==References== | ==References== | ||
#[[BIOL368/F16:Week 4|Assignment 4 Page]] | |||
#CLUSTAL W: Julie D. Thompson, Desmond G. Higgins and Toby J. Gibson, modified; any errors are due to the modifications. PHYLIP: Felsenstein, J. 1993. PHYLIP (Phylogeny Inference Package) version 3.5c. Distributed by the author. Department of Genetics, University of Washington, Seattle. | |||
# Markham, R.B., Wang, W.C., Weisstein, A.E., Wang, Z., Munoz, A., Templeton, A., Margolick, J., Vlahov, D., Quinn, T., Farzadegan, H., & Yu, X.F. (1998). Patterns of HIV-1 evolution in individuals with differing rates of CD4 T cell decline. ''Proc Natl Acad Sci U S A. 95'', 12568-12573. doi: 10.1073/pnas.95.21.12568 | |||
#* [http://www.pnas.org/content/95/21/12568.long Publisher Full text] | |||
#*[http://www.pnas.org/content/95/21/12568.full.pdf+html PDF]. | |||
# Vlahov, D., Anthony, J.C., Munoz, A., Margolick, J., Nelson, K.E., Celentano, D.D., Solomon, L., Polk, B.F. (1991). The ALIVE study, a longitudinal study of HIV-1 infection in intravenous drug users: description of methods and characteristics of participants. ''NIDA Res Monogr 109'', 75-100. | |||
#* [http://www.ncbi.nlm.nih.gov/pubmed/1661376 PubMed] | |||
#* [http://archives.drugabuse.gov/pdf/monographs/download109.html Table of contents and link to download]. | |||
<!--# Cohen MS, Hellmann N, Levy JA, DeCock K, Lange J. The spread, treatment, and prevention of HIV-1: evolution of a global pandemic. J Clin Invest. 2008 Apr;118(4):1244-54. [http://www.jci.org/articles/view/34706 Publisher Full text] [http://www.jci.org/articles/view/34706/pdf PDF].--> | |||
#[https://mylmuconnect.lmu.edu/bbcswebdav/pid-1573583-dt-content-rid-2624558_1/courses/48052.201630/Exploring%20HIV%20Evolution.pdf Exploring HIV Evolution: An Opportunity for Research] | |||
#Higgins, D.G., Bleasby, A.J. and Fuchs, R. (1992) CLUSTAL V: improved software for multiple sequence alignment. Computer Applications in the Biosciences (CABIOS), 8(2):189-191. Thompson J.D., Higgins D.G., Gibson T.J. "CLUSTAL W: improving the sensitivity of progressive multiple sequence alignment through sequence weighting, position-specific gap penalties and weight matrix choice." Nucleic Acids Res. 22:4673-4680(1994). Felsenstein, J. 1989. PHYLIP -- Phylogeny Inference Package (Version 3.2). Cladistics 5: 164-166. | |||
#Markham, R. B., Wang, W.-C., Weisstein, A. E., Wang, Z., Munoz, A., Templeton, A., … Yu, X.-F. (1998). Patterns of HIV-1 evolution in individuals with differing rates of CD4 T cell decline. Proceedings of the National Academy of Sciences of the United States of America, 95(21), 12568–12573. | |||
{{Template: Colin Wikholm}} | |||
Latest revision as of 17:58, 3 October 2016
Exploring HIV Evolution In-Class Activity
Purpose
Methods and Results
Activity 2, Part 1: Looking at Clustering Across Subjects
- Upload the files “visit_1_S1_S9.txt” and “visit_1_S10_S15.txt” into the Biology Workbench nucleic acid tools
- Generate a multiple sequence alignment and genetic tree using 3 clones from each subject (12 total):
- Record the analyzed data in Table 2 (provided):
- Using the tree you generated, perform/aswer the following:
- Draw the tree by hand onto a piece of paper for note-taking:
- Do the clones of each subject appear clustered?
- Yes: Each of the clones are clustered together within their respective subjects. In addition, the clones of subjects 14 and 15 also appear to be clustered together.
- Do some subjects have higher clone diversity than others?
- Yes: Some clones of each subject are closer on the tree than others. For example, subject 14's clones have considerably less genetic diversity than subject 15 (subject 14 clones are much closer to each other on the tree)
- Do any subjects appear in clusters?
- Yes: Subjects 13 and 14 appear in clusters. Subjects 15 and 12 are not as closely clustered and occupy a more loosely conjoined space, but are still relatively clustered. Subject 15, clone 12 is a notable exception and is nearly as closely related to the subject 14 clones as to the other subject 15 clones.
- Describe your tree. Interpret clustering patterns and how they reflect the evolutionary relationships of the subjects' HIV sequences.
- Subjects 14 and 15 have relatively closely related clones. Subjects 12 and 13 have much more distantly related clones compared to the other viruses. Overall, the tree describes 4 different genetically-tied clusters of viruses derived from their respective subjects. In general, clones from the same patient are more closely related to each other, and the genetic diversity within each cluster varies. This suggests that virus clones in each patient evolved from a common ancestor within their subject, although the rate of evolution varies from subject to subject.
- Copy-paste your tree into Word, print it, and share it with the class.
- See trees above


Activity 2, Part 2: Quantifying Diversity Within and Between Subjects
(The answers to the following steps can be found in Table 3)
- Choose one subject and select align all of his or her clones.
- Calculate the S statistic by counting the number of positions with one or more nucleotide difference across the sequences.
- Enter the results of step 2 into Table 3.
- Import the alignment for later use.
- Repeat the analysis for two more subjects.
- Calculate theta for the same three subjects using the following formula:

- For sample size N=5, you would calculate the following: 1+1/2+1/3+1/4+1/5 = 25/12
- Instead of manually finding minimum and maximum pairwise distances, find this using the computer starting by using the Clustdist alignment tool to create the distance matrix of your saved alignment
- Convert the highest and lowest pairwise scores and convert percentages to raw scores (multiple the percentage by the length of the sequence. In most cases, this will be 285)
- Round to integers, record results in Table 3, and repeat the process for the 2 remaining subjects
- To look at the maximum and minimum differences across subjects, start by creating a new alignment with all the sequences of two subjects
- Use Clustdist to create a pairwise distance matrix for the alignment. Find the minimum and maximum differences across the subject sequences.
- Record results in Table 4 and repeat the process across the other pairs.
- Post results of the analysis so that other people may use it while working on Activity 3


Data and Files
Scientific Conclusion
Defining Your Research Project
- What is your question?
- Would the results of Markham et al. be different statistical methods were utilized? Specifically, would using correlation analysis of CD4 T cell decline vs. HIV genetic divergence show a different relationship than the grouping used in the Markham et al. study?
- Make a prediction (hypothesis) about the answer to your question before you begin your analysis.
- I predict that CD4 T cell decline will correlate significantly and positively with HIV genetic divergence. Consequently, the analysis have the same implications of the Markham et al. study.
- Which subjects, visits, and clones will you use to answer your question?
- Justify why you chose the subjects, visits, and clones you did.
- We chose to utilize the four subjects with the greatest number of data points (subjects 6, 8, 9, 14) in order reduce uncertainty while minimizes excess number of subjects. Because of this, we will also utilize all of the subject visits and all the clones for each subject.
- Justify why you chose the subjects, visits, and clones you did.
Acknowledgments
I worked with my group member, Will Fuchs in-class during week 4 to plan our HIV project. We shared ideas during the period, and came to an agreement on our project together. I also worked with Anindita Varshneya and Mia Huddleston in-class to exchange ideas and decide on our group projects. I also took the references and adapted general assignment instructions from the BIOL368/F16:Week 4 page. While I worked with the people noted above, this individual journal entry was completed by me and not copied from another source.
References
- Assignment 4 Page
- CLUSTAL W: Julie D. Thompson, Desmond G. Higgins and Toby J. Gibson, modified; any errors are due to the modifications. PHYLIP: Felsenstein, J. 1993. PHYLIP (Phylogeny Inference Package) version 3.5c. Distributed by the author. Department of Genetics, University of Washington, Seattle.
- Markham, R.B., Wang, W.C., Weisstein, A.E., Wang, Z., Munoz, A., Templeton, A., Margolick, J., Vlahov, D., Quinn, T., Farzadegan, H., & Yu, X.F. (1998). Patterns of HIV-1 evolution in individuals with differing rates of CD4 T cell decline. Proc Natl Acad Sci U S A. 95, 12568-12573. doi: 10.1073/pnas.95.21.12568
- Vlahov, D., Anthony, J.C., Munoz, A., Margolick, J., Nelson, K.E., Celentano, D.D., Solomon, L., Polk, B.F. (1991). The ALIVE study, a longitudinal study of HIV-1 infection in intravenous drug users: description of methods and characteristics of participants. NIDA Res Monogr 109, 75-100.
- Exploring HIV Evolution: An Opportunity for Research
- Higgins, D.G., Bleasby, A.J. and Fuchs, R. (1992) CLUSTAL V: improved software for multiple sequence alignment. Computer Applications in the Biosciences (CABIOS), 8(2):189-191. Thompson J.D., Higgins D.G., Gibson T.J. "CLUSTAL W: improving the sensitivity of progressive multiple sequence alignment through sequence weighting, position-specific gap penalties and weight matrix choice." Nucleic Acids Res. 22:4673-4680(1994). Felsenstein, J. 1989. PHYLIP -- Phylogeny Inference Package (Version 3.2). Cladistics 5: 164-166.
- Markham, R. B., Wang, W.-C., Weisstein, A. E., Wang, Z., Munoz, A., Templeton, A., … Yu, X.-F. (1998). Patterns of HIV-1 evolution in individuals with differing rates of CD4 T cell decline. Proceedings of the National Academy of Sciences of the United States of America, 95(21), 12568–12573.
Important links
Bioinfomatics Lab: Fall 2016
Class Page: BIOL 368-01: Bioinfomatics Laboratory, Fall 2016
| Weekly Assignments | Individual Journal Assignments | Shared Journal Assignments |
|---|---|---|
|
|
|