Biomod/2013/UT-Austin/Results: Difference between revisions
No edit summary |
|||
| Line 1: | Line 1: | ||
{{Template:Biomod/2013/UT-Austin}} | |||
==Results== | ==Results== | ||
===Linear Catalyst Controls=== | ===Linear Catalyst Controls=== | ||
Revision as of 22:34, 26 October 2013
<html> <style type="text/css"> //<!--
/* Define the background of the whole page */
@media screen {
body { background: #c5d0ea 0 0 no-repeat; }
} /* Define the div holding the page contents */
- globalWrapper{
 left: 50%;
 height: 100%;
 background-color: #FFFFFF;
 width: 900px;
 margin-left: -450px; /* Should be width / 2 */
 margin-top: 0px;
 margin-bottom: 0px;
 margin-right: 0px;
 padding: 0 0 0 0;
 position: absolute;
} .toc{
display:none;
} /* Hide the page heading at top */ .firstHeading {display:none;} /* Hide the bar at the left */
- column-one {display:none;}
/* Define the div holding the page contents (this div is inside globalWrapper. We override its default margins) */
- content{
 margin: 0 0 0 0;
 font: normal 100% sans-serif;
 color: #000033;
 padding: 12px 12px 12px 12px;
 background-image: url()" ; background-repeat: no-repeat;
 border: 0;
} /* Miscellaneous stuff. Feel free to add style definitions. */ /* h3 {
 /*
 color: #CC5500;
 font: normal 3em sans-serif;
 letter-spacing: 1px;
 margin-bottom: 0;
 */
 color: #000000;
 font-style: normal;
 font-size: 39px;
 font-family: 'Playbill2', 'Playbill', sans-serif;
 //font-stretch: ultra-expanded;
 letter-spacing: 1px;
 margin-bottom: -10px;
 line-height: 25px;
 padding-bottom: 0px;
}
- /
h2 {
 color: #000000;
 font-style: normal;
 font-size: 39px;
 font-family: 'Montaga', serif;
 //font-stretch: ultra-expanded;
 letter-spacing: 1px;
 margin-bottom: -10px;
 line-height: 25px;
 padding-bottom: 0px;
} h1 {
 /*
 color: #CC5500;
 font: normal 3em Montaga;
 letter-spacing: 1px;
 margin-bottom: 0;
 */
 color: #000000;
 font-style: normal;
 font-size: 39px;
 font-family: 'Montaga', serif;
 //font-stretch: ultra-expanded;
 letter-spacing: 1px;
 margin-bottom: -10px;
 line-height: 25px;
 padding-bottom: 0px;
}
.scriptFont {
  color: #0;
  padding-top: 5px;
  font: normal 1em Georgia;
}
//-->
</style>
<div style="text-align:center" />
<a href="http://openwetware.org/wiki/Biomod/2013/UT-Austin"><img src="http://openwetware.org/images/2/2f/G4262.png" width ="50%" height="50%"/><br />
<!-- links at top -->
<div class="linkconcept linkgeneral">
<a href="http://openwetware.org/wiki/Biomod/2013/UT-Austin/Introduction"><img src="http://openwetware.org/images/0/0d/Intro.png" width="20%" alt="" /></a>
</div> <div class="linkdesign linkgeneral">
<a href="http://openwetware.org/wiki/Biomod/2013/UT-Austin/Design"><img src="http://openwetware.org/images/0/0a/Design.png" width="10%" alt="" /></a>
</div> <div class="linkmethods linkgeneral">
<a href="http://openwetware.org/wiki/Biomod/2013/UT-Austin/Methods"><img src="http://openwetware.org/images/0/07/MEthods.png" width="15%" alt="" /></a>
</div> <div class="linkresults linkgeneral">
<a href="http://openwetware.org/wiki/Biomod/2013/UT-Austin/Results"><img src="http://openwetware.org/images/1/17/Results.png" width="12%" alt="" /></a>
</div> <div class="linkmembers linkgeneral">
<a href="http://openwetware.org/wiki/Biomod/2013/UT-Austin/Team Info"><img src="http://openwetware.org/images/3/32/Team.png" width="15%" alt="" /></a>
</div> <div class="linkrefs linkgeneral">
<a href="http://openwetware.org/wiki/Biomod/2013/UT-Austin/References"><img src="http://openwetware.org/images/0/0d/References.png" width="20%" alt="" /></a>
</div> <div style="clear: both;" ></div>
</div>
</html>
Results
Linear Catalyst Controls
In order to ensure that the MDM2 and Ricin sequence adapted CHA circuit pieces function properly, H1, H2, and the reporter duplex were tested with a continuous catalyst oligo that contained all catalytic domains.

In order to relate fluorescence units with concentration of activated reporter, a standard curve (Figure 12) for the ricin generated apurinic site reporter fluorophore, BioM_RepFp1, was prepared. The linear regression for the above standard curve indicated that [BioM_RepFp1]=(Fluorescence Units-9.5238)/(12.019) with an R2 of 0.97. This equation was used to convert fluorescence values to concentrations for the continuous catalyst tests, Figure 13.

Fitting the data to a single exponential function, Figure 14A, allows us to assess the rate of signal amplification at various fluorophore concentrations, Figure 14B. Table 2 summarizes the data presented in Figure 14. The maximal observed rate, 0.1 min-1, is about a third of the lower observed rates from literature values, 0.35 min-1. The modified hairpin designs to adapt to the target sequence likely lowered the efficiency of signal amplification. These results still indicated that our ricin generated apurinic site hairpins function properly and should work with a split catalyst. Similar analysis was performed on the MDM2 SNP309 hairpins, and the results are summarized in Table 3.

| Rate vs Concentration for Apurinic Circuit | ||
| BioM_Cat_1,2,3p1 Concentration (nM) | Observed Rate (min-1) | Standard Error |
|---|---|---|
| 0 | 0.0062 | 0.003 |
| 10 | 0.044 | 0.008 |
| 20 | 0.076 | 0.01 |
| 30 | 0.10 | 0.03 |
| Rate vs Concentration for MDM2 Circuit | ||
| BioM_Cat_1,2,3p1 Concentration (nM) | Observed Rate (min-1) | Standard Error |
|---|---|---|
| 0 | 0.099 | 4.3 |
| 12.5 | 0.1 | 4.5 |
| 25 | 0.099 | 4.2 |
MDM2 Gene segment construction
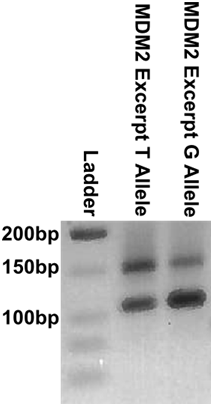
In order to rapidly test MDM2 circuits on a sample MDM2 template, our team cloned a small 149 bp excerpt, Figure 15. This construction was performed through overlapping PCR, Figure 16. For long term storage and sequence confirmation, Figure 17, the purified full length template, was TA cloned into a pCR™2.1 backbone. Additionally, purified full length template was used to generate ssDNA for scCHA testing through assymetric PCR, Figure 18.


Conclusion and Future Direction
Apurinic site detection and allelic distinction remain the ultimate goal of this work. We have achieved a number of necessary steps to achieve this goal. We have determined that our hairpin design for the apurinic site detection circuit functions as expected with a continuous catalyst oligo. Further characterization of this circuit with the split catalyst and apurinic/purinic targets will need to be done. We have various MDM2 constructs built for testing, but the circuit design will need reworking.