BioSysBio:abstracts/2007/Imtiaz Khan
A Bioinformatics approach for the interrogation of molecular events in single cells: transforming fluorescent timelapse microscopy images into numbers
Author(s): Imtiaz Khan 1, Janet Fisher 2, Nuria Marquez2,Paul Smith 2 and Rachel Errington 3
Affiliations: 1Biostatistics and Bioinformatics Unit, School of Medicine, Cardiff University, Cardiff, CF14 4XN, UK. 2Department of Pathology, School of Medicine, Cardiff University, Cardiff, CF14 4XN, UK. 3Department of Medical Biochemistry and Immunology, Cardiff University, Cardiff, CF14 4X, UK.
Contact: Imtiaz Khan
Keywords: Cell Cycle, Cell lineage, Bioinformatics, Timelapse microscopy.
Abstract
Cell-based assays, for high-content-screening, demand unique solutions which enable image encoding and interrogation of spatio-temporal cellular events. Our overall aim is to develop data mining tools and mathematical models capable of producing predictive cell response profiles for use in pre-clinical screening, experimental therapeutics and hypothesis-driven research. Our principal paradigm is that cellular bioinformatics interrogation of kinetic microscopy data opens a route to revealing the nature and time frames for the modulation of the cell cycle in disease and under stress. A high level informatics enables linking of multi-scalar events that comprise innate and induced population heterogeneity in dynamic cellular systems. We have developed a bioinformatics environment where analysis tools efficiently encode microscopy images into numbers and deposit the extracted descriptors into a relational database for sequential data access and data visualisation. In this current work we show that this bioinformatics approach to image derived cell-based measurements reveals inter-event relationships such as novel cellular phenotypic and molecular bifurcation patterns.
Introduction
Exploring and exploiting the enormous potential for pharmacological modulation of the mammalian cell cycle are key goals for basic research and drug discovery. We have developed a critical advance - the high temporal resolution monitoring of cell cycle progression enabling the tracking of single cell checkpoint transitions in a non-invasive manner even within heterogeneous populations. The green fluorescent protein (GFP)-based probe has expression, location and destruction characteristics that shadow cyclin B1 dynamics in living cells [1]. The non-perturbing stealth reporter performance has been validated on high content to high throughput detection platforms comprising multi-well high-throughput screen (HTS) imaging, single cell kinetic-tracking and multi-parameter flow cytometry [1,2]. Cyclin B1-GFP tracking provides sub-phase information on cell cycle progression, cell-cycle regulator dynamics in parallel with morphological landmarks and DNA content analysis. We have sought to track the continuous progression of cell cycle traverse and encode molecular readouts in bifurcating lineages.
Single cell lineages which underlie the basic concept provide an elegant assay for determining the evolving and complex interplay for tumour survival at the single cell level. Cell lineage mapping has been most comprehensively described for Caenorhabditis elegans to elucidate developmental mechanisms and nematode evolution [3,4]. Lineage tracking imposes a labour-intensive task and a limited amount of software tools have been developed to ease this burden [5]. In experimental terms a cell lineage is defined as descent in a line from a common progenitor that was exposed to a given influence for a discrete period. The behaviour of both the progenitor and the descending line of offspring reveal the time-integrated pharmacodynamic response (e.g. changes in inter-generation cell division time or cell death). For example, this would have direct relevance to how viable populations, representing resistant fractions, might be maintained in drug-treated tumour cell populations. Time-lapse imaging and analysis has been used in this context extensively by others to examine the viability and proliferation of uninucleated and multinucleated giant cells formed after 6 Gy X irradiation [6] or apoptotic induction post-irradiation in p21 gene knock out cell lines [7]. However we have experience with our studies that these types of analysis encounter sever hurdles without a meta-data structure that allows for parameter management. It also severely restricts the approaches to data analysis to a time-orientated analysis rather than a lineage or relationship analysis.
Our primary premise is that a bioinformatics approach to cell-based measurements provides an essential route to determining inter-event relationships revealing novel cellular and molecular event patterns. Our overall aim is to develop an integrated bioinformatics environment where analysis tools efficiently encode microscopy images into numbers and deposit the encoded data into relational databases. The intention is to provide a web-based interface with access to a suite of databases called CyMART-Databases which provides data access enabling robust hypothesis-driven data-mining and drug signature queries.
Materials and Methods
Cell molecular reporter system. The parental cell line used in these studies was a human osteosarcoma cell line derived from a 15 year old Caucasian female U-2 OS (ATCC HTB-96)23. U-2 OS cells was transfected with G2M Cell Cycle Phase Marker (GE Healthcare, UK) using Fugene (Roche) according to the manufacturers instructions. Following selection with 1000ug/ml Geneticin (Sigma G7040) the expressing cells were enriched using high speed FACS (Mo Flo (Dako) and sorted into 96 well plates (1 green fluorescent cell/well). Colonies were expanded and clones whose green fluorescence varied with the cell cycle as predicted and as determined by flow cytometry were selected for the current study.
Cell culture and maintenance condition. The stably transfected cells were maintained at 37°C and 5 % CO2 using standard tissue culture techniques. Media used was McCoys 5A modified (Sigma) supplemented with 2mM glutamine, 100 units/ml penicillin, 100 μg/ml streptomycin, 10 % fetal calf serum and 1000 μg/ml geneticin.
Single cell time-lapse screening. High resolution fluorescence cell tracking was performed with cells seeded into a 12 well coverslip-bottomed multi-well plate. Immediately post-addition (of a drug perturbation) the cultured dishes were placed on to a time-lapse instrument designed to capture bright-field phase images and GFP fluorescence (480/25 nm excitation and 525/30 nm emission). An Axiovert 100 microscope (Carl Zeiss, Welwyn Garden City, UK), was fitted with an incubator for 37°C/5% CO2 maintenance (Solent Scientific, Portsmouth, UK), and an ORCA-ER 12-bit, CCD camera (Hamamatsu, Reading, UK). Illumination was controlled by means of a shutter in front of the transmission lamp, and an an x,y positioning stage with separate z-focus (Prior Scientific, Cambridge, UK) controlled multi-field acquisition. Image capture was controlled by AQM 2000 (Kinetic Imaging Ltd). All images were collected with a 40x, 0.75 NA air apochromat objective lens providing a field size of 125x125 μm. Sequences were captured every 20 minutes for 48 hours, ordinarily at least three fields per treatment regime. At the end of the experiment the images were stacked and saved as *.stk or *.AVI format. MetaMorph (Molecular Devices, California) was used to view the stacked image as sequence of images. We then developed FluroTRAK (in-house software) to work in conjunction with MetaMorph to encode and transform the images into a parametised database.
FluroTRAK. For each microscopy or image based screen, all experimental descriptors were documented into a simple accessible excel file. This screen file acts as a digital laboratory notebook where all experimental descriptors for all drug screens were recorded with some details being recorded manually, while many, such as the progenitor cell morphological descriptors derived from the raw images, were acquired semi-automatically via a Perl script which communicates with MetaMorph. The principal objective of this screen file is to attribute a unique encryption tag for each origin or starting cell within the field which we term ‘progenitor cell’. This is critical, since the complexity evolves as each progenitor cell divides or dies and hence produces progeny which populate a full lineage. Therefore every subsequent event within the lineage can be rooted or associated to the progenitor cell including tagged parameters.
FluroTRAK is part of an ‘in-house’ software encoding suite ‘CyMART-Tools’ designed to parametise fluorescent time-lapse microscopy image sequences. FluroTRAK has been written in a single Perl script and the Perl-Tk module has been used to generate the graphical user interface and the canvas upon which the lineage is displayed. The software is divided into three interlinked parts. The first part interacts with the digital laboratory notebook mentioned above and directs users to a specific progenitor cell location, this part of the programme also generates the tag through which the progenitor cell becomes indexed later in the database. The second part interacts with MetaMorph and draws the evolving lineage to the canvas. Finally, the third part writes the image derived parameters associated with each cell of the lineage into a tab delimited text file.
Encoding the fluorescent images. A user sequentially selects experimental attributes based on experiment, well, field and cell position, additionally a graphical display of the multi well plate facilitates users in navigating a sequential sieving process. FluroTRAK dynamically interacts with the digital laboratory notebook and generates the informative graphical display. For example, when a particular experiment has been chosen by the user, FluroTRAK interacts with the screen file and both reads and display all information regarding each well within the specific screen the process continues up till the cell level selection. When the tagging is complete, a cell is created in the canvas of FluroTRAK, the raw image counter part of this newly created cell is located in the MetaMorph video window and tracked. MetaMorph is interfaced with FluroTRAK via a dynamic data exchange link log file. For the cell of interest, in each frame three regions-of-interest (ROIs) are used to extract parameters from the raw image sequence viewed in MetaMorph. The first ROI is always positioned on the nucleus and the other two ROIs are positioned on the cytoplasmic regions, usually on the opposite side of the nucleus of the cell of interest. For each ROI, MetaMorph extracts 10 parameters from the raw image and the parameter includes – Frame number, X coordinate, Y coordinate, width of ROI in pixel, average intensity, Intensity standard deviation, intensity signal/noise ratio, integrated intensity, minimum intensity, maximum intensity. Once the ROIs are positioned, the cell of interest is tracked frame by frame starting at frame one. Increment of the frame is automatic when the user presses the ‘Log Data’ button in the MetaMorph, for any frame if the cell of interest moved considerably from its last frame position, users need to reposition the ROIs manually. Additionally when ‘Log Data’ button is pressed, major and minor events are also logged for that frame. Both event types are displayed in the ‘Labeled Logged Data’ window of MetaMorph, by default the major event is ‘N’ and the minor event is ‘null’ meaning no major and minor event respectively. However with the progression of logging in a frame by frame manner, when some changes (rounding up) happens to the cell, users need to change the minor event to ‘start’ from its default ‘null’ label indicating some event has started to happen and finally when the event (mitosis, death) ends users changes the major event label accordingly and minor event label to ‘end’, indicating some major event has ended. According to the major event and the time associated with it, FluroTRAK draws the lineage within the canvas. While encoding, it is often required to revisit the bifurcating points (where one cell divides into two daughter cells) in the image, because only one cell can be tracked at any given time. FluroTRAK has this feature through which any bifurcating point of a lineage can be indexed in the raw image sequence viewed under Metamorph. Once a lineage for a progenitor cell is complete it is saved as a text file. Any complete or partially encoded lineage can be visualized just by selecting the appropriate lineage text file and editing (delete part of the lineage) is also possible. The editing feature of FluroTRAK provides the opportunity to users to delete any part of the lineage which contributes an added layer of accuracy to the encoded lineage data. FluroTRAK provides complete flexibility as it can map lineages based on all possible outcomes of a cell division, for example unusual circumstances such as the generation of three or four daughters due to abnormal cytokinesis, or the generation of a polyploidy cell. FluroTRAK also assigns to each cell a unique identifier, the start or the progenitor cell is named as ‘B’ if this cell divides into two daughter cells then the two daughters are named as ‘BN’ and ‘BS’ respectively. For a re-fused or polyploidy outcome the designation is ‘BE’. Three individual daughters are named ‘BN’, ‘BE’ and ‘BS’ while four daughters are named ‘BN’, ‘BU’, ‘BL’ and ‘BS’ respectively. This identification pattern also establishes the relationship between different cells within a lineage.
This semi-automated and user directed fashion of lineage encoding from the raw images is indeed time consuming, depending upon the size of the lineage, expertise of the user and cell density in the image, it may take few minutes to an hour to encode a lineage. This semi-automated manner of encoding is undeniably the rate limiting step but user’s interaction ensures the highest precision of the data being encoded. A combination of automated and user-interactive bioinformatics software has been suggested within a recent review as the challenge and opportunity for the next generation high content screening [8]. Once the encoding of a lineage is complete, the completed lineage dataset is placed into the temporary lineage database where all lineage data are stored in tab delimited text file format. One lineage constitutes a single text file and the name of the text file is the tag assigned to the progenitor cell. The tag or name of a lineage has 23 parameters associated with it, which makes it distinguishable from all other lineages of the database. Within the text file each row represents a cell in a particular frame and 30 columns of data represents the data from 3 ROIs (10 data points for each ROI) for that cell in that frame. Unique nomenclature of the cells within a lineage enables any computer language to access the data while maintaining lineage relationships, and moreover the nomenclature of the lineage itself facilitates lineage classification based on user defined conditions, e.g. drug dose. All lineages accumulated as text files are subjected to an automated but rigid quality control check which ensures that all lineages are stored in the correct data structure. Once passed, data from these text files are extracted to populate the CellCycleDB, which is a MySQL database and can be accessed via standard web browser.
Result
Continuous cell cycle tracking at the single cell level. The fluorescent G2M Cell Cycle Phase Marker reporter system depends on the control of expression levels and location of GFP as a cell progresses to the later cell cycle stages and negotiates mitotic entry and exit. This is achieved by using the functional components from cyclin B1 to confer switch-like properties to the stealth reporter. Expression is driven by the promoter region, removal via the destruction box (D-box) and translocation from the cytoplasm to the nucleus compartment via the cytoplasmic retention signal (CRS). Cyclin B1 expression is tightly regulated and acts as a major control switch suitable for following the transition from S-phase through the G2 phase into mitosis. Importantly since the cyclin box is absent from the reporter it does not interfere with or perturb cell cycle progress.
An important aspect of the cyclin B1-GFP signal readout is whether it is amenable to parameterisation and hence potentially incorporated into algorithms for automated analysis and signature identification. Time-based tracking of the cyclin B1-GFP fluorescence at the single cell level revealed an average intermitotic time of 27.3 ± 6 hours, with an overall relative increase of fluorescence of 3.4 ± 0.8 fold from basal expression in G1 to G2 levels (pre-mitosis). A time-lapse microscopy image sequence shows cells traversing the cell cycle and fluorescence changes as the cell progresses to mitosis from G1, individual cells ramped up cyclin B1-GFP expression (became brighter), a translocation event (cytoplasm to nucleus) occurred just before mitosis. Finally, the fluorescence signal decreased back to basal levels during cell division, triggered at metaphase, and occurred on average over 2 ± 0.8 hours.

Figure 1: Continuous cell cycle tracking: (A). Diagrammatic representation of a cell expressing the cyclin B1-GFP reporter as it progress through the cell cycle to mitosis. (B) Snapshots from a timelapse phase contrast sequence to indicate cell morphology, cell position and delivery to mitosis; and (C) Corresponding fluorescence channel in the same sequence to show cyclin B1-GFP expression and hence cell cycle position and progression, cell indexed by arrow is tracked through interphase (G1,S and G2) and mitosis (divided into three sub phases – Prophase, Metaphase and Telophase), before successful segregation to two daughter cells.
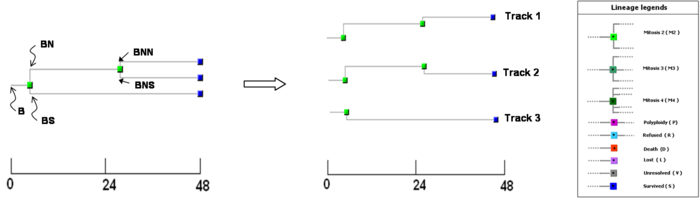
Figure 2: Encoded cell lineage. An exemplar lineage encoded from a progenitor cell (B), where the cell divides into two daughter cells 5 hours after the start of the experiment. The north daughter (BN) again divides at 27.66 hours into two daughter cells BNN and BNS while the south daughter BS failed to divide within the duration of the experiment. Three living cells (BNN,BNS and BS) at the end of the experiment yielded three tracks labelled as track 1 2 and 3 respectively.

Figure 3: Single cell tracking of multilevel scalar events: Intensity, motility and directionality for the three tracks derived from the typical lineage shown in figure 2. Upper row depicts the cyclin B1-GFP intensity profile along each track, three compartments were tracked the nucleus (red line) and corresponding cytoplasm (black line (two regions of interest)). Middle row depicts motility of the same cell (derived from position of nucleus). Motility (in pixels) is the distance travelled by the cell between each consecutive plane (20 minutes interval) and was calculated using Pythagorean theorem for distance measurement here it presented in a cumulative fashion. Lower row shows the average angular direction of the cell at every 4 hour time interval. Considering the nuclear position of each cell as the positional point, the tangent angle of each consecutive plane was measured and averaged for each 4 hour interval. NOTE when considering the motility along a particular track, an abrupt increase of the motility corresponding to M phase of cell cycle is observed which is solely attributed to a translation of the dividing cells (ie a mechanical artefact).
Access to molecular-fingerprints derived from a cell lineage map. A typical cell lineage over 48 hours illustrates a simple progression of a progenitor cell (B) dividing into two daughter cells and cellular information at two levels (i) phenotypic behaviour (division and motility) and (ii) fluorescence reporter readout (cyclin B1-GFP, hence cell cycle position) at the single cell level. The lineage shown in figure 2 consists of 3 overlapping and inter-related tracks. For the first 5 hours all three tracks are identical, since they belong to a single cell (B) (the lineage root). A division occurs at this point (node 1) and subsequently for the same reason track 1 and track 2 are identical up until 27.6 hours (node 2), where a second division occurs. The temporal distance between node 1 and node 2 illustrates a typical cell cycle inter-mitotic time of around 22 hours. The reporter tracking of the cyclinB1-GFP probe intensity in the cytoplasm starts to rise 4 hours after node 1 (in cell cycle terms this would correspond to late-G1 phase), while the intensity from the nucleus remained low virtually until node 2 (in cell cycle terms this is late-G2 phase), the translocation occurs just prior to the dramatic change in cell shape from flat at node 2. Node 2 marks the mitotic event and the cyclin B1-GFP intensity attenuates back to basal levels both in the cytoplasm and nucleus. The translocation event at node 2 represents a major cellular commitment from G2 to mitosis (M). If we track the intensity, motility and directionality variation between the original two sister cells at node 1 (BN and BS) we observe that there is no further major cellular event for BS (no more nodes and therefore no cell division); and the cyclin B1-GFP profile remains flat compared to the increasing intensity of BN depicted both in track 1 and track 2. In cell cycle terms this is interpreted as a G1 arrest of BS; by extracting simultaneously cell position, we show that this arrest in G1 corresponds to a halt in cell motility. The ability to determine directed cell migration of cells during wound healing, chemotaxis responses and tumour invasion is also important therefore alongside the total or net distance moved we can calculate the directionality of movement as a vector. Taking all three readouts for all three actual tracks we have linked phenotypic and molecular information mapped onto a relationship or lineage map.
Conclusion
In the current study we describe a novel cell lineage encoding method that has enabled us to parametise molecular signatures derived from a stealth fluorescence reporter on a bifurcation map that represents cellular proliferation phenotypic responses. FluroTRAK provides a step change in our ability to encode and access information on multi-scalar dynamic cell behaviour. We believe that kinetic measurements provide an essential route to revealing important time windows and informative cells to study the mechanism of action of individual pharmacological agents and their response pathways. This encoding process encapsulates the critical features of cell-cell heterogeneity, molecular dynamics, phenotypic behaviour and time-dependent events. The multi-level descriptors and parameters attributed to each cell (and at each node), within the resultant cell lineage maps, provide a unique framework for applying bioinformatics-like query algorithms such as those used for genomic databases, and the ability to locate with high temporal resolution cell cycle phase traverse and checkpoint responses. Cells responding to pharmacologically active agents in a non-invasive manner provides a means of linking causative events with later outcomes at the molecular level and the data generated creates the opportunity for pharmacokinetic (PK) and pharmacodynamic (PD) modelling and validation of intracellular dynamics in response to drug. The dynamic motility and directionality parameters would have important implications for wound healing and requires further dissection at the molecular level to determine the mechanisms which underpins the complex cellular interplay. The lineage map importantly provides a functional map upon which other information can be linked, such as single snapshot biomarker expression, proteomic and genomic expression data. The approach may also address the significant challenge of tracking the evolution of clonal variation in tumour cell populations using micro-array approaches.
Future
Another aspect of this work is to develop predictive algorithms which link our screen data with mathematical models describing drug-target interaction and cellular driven resistance mechanisms at the PK and PD level. [9]. Importantly, the parameter outputs from our lineage databases translate directly to clinically relevant indicators of the therapeutic response of tumour cell populations in terms of initial response, growth delay and the appearance of surviving (‘resistant’) cells with distinct progenitor characteristics or evolving phenotypes.
Establishing FluroTRAK in such a generic way enables us to adapt to any type of high-content screening assay; work is underway to interlink multi-scalar data generated from different assay platforms. A significant challenge for us is to convert FluroTRAK into an automated encoding programme while maintaining the current highly robust event identification element. This is not a trivial undertaking and will require some novel cell tracking algorithms appropriate for fluorescent microscopy image sequences.
Implementation and update
Work is in progress to establish the lineage information for the CellCycleDB and the outcome of this work will be located at our main CyMART site, which contains other lineage databases such as ProgeniDB. CyMART offers a query approach for data sieving and navigation through the appropriate experimental screens. A detailed description of the basic concepts behind the CyMART family of databases is available. The contents of the databases will be updated quarterly. New functionalities such as visualisation and data mining modules for determining functional relationships between phenotypic behaviour and molecular profiling will be pursued.
Web address for CyMART: http://biodiversity.cs.cf.ac.uk/cymart/
References
[1] N Thomas and ID Goodyear: Stealth sensors: real-time monitoring of the cell cycle. Targets 2003, 2: 26-23.
[2] N Thomas: Lighting the circle of life. Cell Cycle 2003, 2(6): 545-549.
[3] PW Sternberg and HR Horvitz: Gonadal cell lineages of the nematode Panagrellus redivivus and implications for evolution by the modification of cell lineage. Dev. Biol. 1981, 88: 147-166.
[4] G Borgonie, K Jacobsen, A Coomans: Embryonic lineage evolution in nematodes. Nematology 2000, 2: 65-69.
[5] V Braun, RB Azevedo, M Gumbel, PM Agapow, AM Leroi, HP Meinzer: ALES: cell lineage analysis and mapping of developmental events. Bioinformatics 2003, 19(7): 851-858.
[6] G Prieur-Carrillo, K Chu, J Lindqvist, WC Dewey: Computerized Video Time-Lapse (CVTL) Analysis of the Fate of Giant Cells Produced by X-Irradiating EJ30 Human Bladder Carcinoma Cells. Radiation Research 2003, 159: 705-712 .
[7] K Chu, N Teele, N Albright, WC Dewey: Computerized Video Time Lapse Study of Cell Cycle Delay and Arrest, Mitotic Catastrophe, Apoptosis and Clonogenic Survival in Irradiated 14-3-3s and CDKN1A (p21) Knockout Cell Lines. Radiation Research 2004, 162: 270-286.
[8] DL Taylor, KA Giuliano: Multiplexed high content screening assays create a systems cell biology approach to drug discovery. Drug Discov Today Technologies 2005, 2(2): 149-154.
[9] ND Evans, RJ Errington, M Shelley, GP Feeney, MJ Chapman, KR Godfrey, PJ Smith, MJ Chappell: A mathematical model for the in vitro kinetics of the anti-cancer agent topotecan. Math Biosci 2004, 189(2): 185-217.