BME103 s2013:T900 Group1 L2: Difference between revisions

From OpenWetWare
Jump to navigationJump to search
Line 31: Line 31:


'''SYBR Green Dye'''<br>
''[A short summary describing SYBR green dye]''<br>
SYBR Green dye is a fluorescent dye that binds to double-stranded DNA, but will stain single-stranded DNA with lower performance.


'''Single-Drop Fluorimeter'''<br>
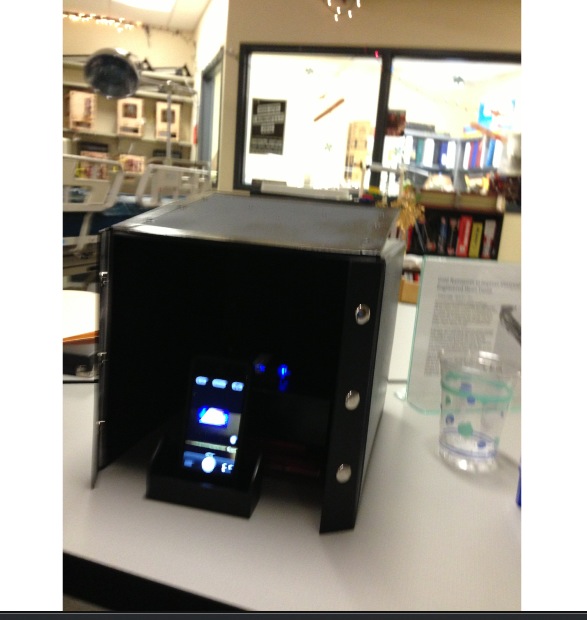
Fluorimeter is a device that is used to measure the amount fluorescence in a single drop.


'''Single-Drop Fluorimeter'''<br>
''[A description of the single-drop fluorimeter device. Add a PHOTO for bonus points]''<br>
[[Image:Photo(2).JPG]]
[[Image:Photo(2).JPG]]


Revision as of 18:29, 1 April 2013

BME 103 Spring 2013 Home
People
Lab Write-Up 1
Lab Write-Up 2
Lab Write-Up 3
Course Logistics For Instructors
Photos
Wiki Editing Help


OUR TEAM

Kristi Norris:
Protocol Planner
Carlos Renteria:
Research and Design Specialist
Raul Monzolo:
Open PCR Machine Engineer
Johnny Montez:
Open PCR Machine Engineer
Robert Sanchez:
Research and Design Specialist
Group 1


LAB 2 WRITE-UP

Background Information

SYBR Green Dye
SYBR Green dye is a fluorescent dye that binds to double-stranded DNA, but will stain single-stranded DNA with lower performance.

Single-Drop Fluorimeter
Fluorimeter is a device that is used to measure the amount fluorescence in a single drop.


How the Fluorescence Technique Works
[In your own words, a summary of the information from page 9 of the worksheet]


Procedure

Smart Phone Camera Settings

  • We used an Iphone 5
    • Flash:None
    • ISO setting:NA
    • White Balance:NA
    • Exposure:NA
    • Saturation:NA
    • Contrast:NA
  • No additional phone used

Calibration

We inserted the Iphone inside a cradle that gave us a right angle view. Afterward we adjusted the height of the phone so that it is as even with the drop.

  • Distance between the smart phone cradle and drop = 3cm


Solutions Used for Calibration [See worksheet page 5]

row 1 cell 1 row 1 cell 2 row 1 cell 3 row 1 cell 4
row 2 cell 1 row 2 cell 2 row 2 cell 3 row 2 cell 4
row 3 cell 1 row 3 cell 2 row 3 cell 3 row 3 cell 4

[Add more rows as needed]


Placing Samples onto the Fluorimeter

  • [Step one, in your OWN words]
  • [Step two, in your own words]
  • [Step three, in your own words]
  • [etc.]


Data Analysis

Representative Images of Samples


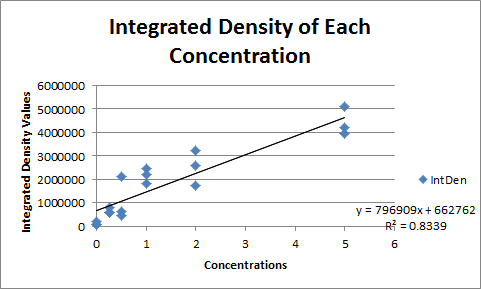
Image J Values for All Samples [See worksheet page 5]

Concentration Integrated Density Integrated Density of Background Area of Circle Mean Gray Value
Water 213454 ?? 6691 31.902
Water 93371 ?? 2422 38.551
Water 65949 ?? 1219 54.101
0.25 593913 ?? 7333 80.992
0.25 569386 ?? 6988 81.481
0.25 791593 ?? 8917 88.773
0.5 651140 ?? 7774 83.759
0.5 453045 ?? 5146 88.038
0.5 2142033 ?? 15458 138.571
1 2458883 ?? 12175 201.962
1 1836054 ?? 9380 195.741
1 2223630 ?? 11335 196.174
2 1721563 ?? 6868 250.664
2 3215604 ?? 12780 251.612
2 2577701 ?? 10205 252.592
5 3957423 ?? 15704 252.001
5 4194978 ?? 16748 250.476
5 5088859 ?? 20200 251.924

[Add more rows as needed]


Fitting a Straight Line