BME103:T130 Group 12: Difference between revisions
No edit summary |
No edit summary |
||
| Line 40: | Line 40: | ||
'''Test Run''' | '''Test Run''' | ||
The test run was done November 1st, 2012. Machine number 12 was used and there were minimal problems. It felt as if the machine was running slower than it should, but other than that all went well.<br> | |||
Revision as of 18:15, 14 November 2012
| Home People Lab Write-Up 1 Lab Write-Up 2 Lab Write-Up 3 Course Logistics For Instructors Photos Wiki Editing Help | |||||||||||||||||||||||||||||||||||||||||||||||||||||||||
OUR TEAM
LAB 1 WRITE-UPInitial Machine TestingThe Original Design The Open PCR machines is a DYI device that is composed of many circuit boards, wires, and a wooden frame. It is to be used to cycle DNA by oscillating the temperature of the DNA samples. This machine predominately works when the samples are placed in the main heating block, at which point a heated lid is placed down on top of the samples. Once the software for this Open PCR device is set up, the temperature change and the actual process begins. Within the Open PCR machine is a multitude of parts that keep the machine intact. These parts include a heat sink and fan to absorb heat, a circuit board that runs all the parts, a power supply to maintain the electricity, and a LCD display to show the user information. In conclusion, all of these parts work cohesively to generate this working machine known as the Open PCR. Experimenting With the Connections It is important to note that the LCD display will not work if it is not connected to the Open PCR circuit Board. Also, the temperature will not be shown on the LCD display if the white wire connecting to the main heating block is disconnected from the Open PCR circuit board.
The test run was done November 1st, 2012. Machine number 12 was used and there were minimal problems. It felt as if the machine was running slower than it should, but other than that all went well.
ProtocolsPolymerase Chain Reaction A polymerase chain reaction (PCR) is based on the enzyme DNA Polymerase's ability to synthesize complementary DNA strands. Through a series of steps involving polymerase breaking apart a DNA strand and then synthesizing a specified complementary piece, a PCR machine is able to isolate and amplify a desired strand of DNA.
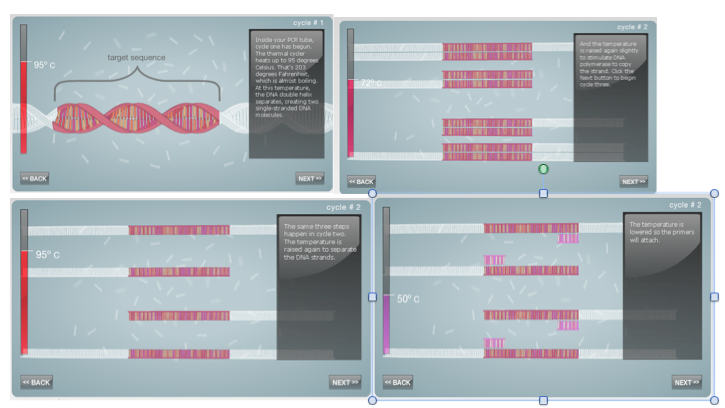
Steps to Amplify a Patient's DNA Sample 1. PCR uses controlled temperature changes to make copies of DNA. Heat (about 95°C) separates double-stranded DNA into two single strands; this process is called denaturation. 2. "Primers", or short DNA strands, binds to the very end of the complimentary sequence that is being replicated. This step is called annealing, which takes place between 40°C and 65°C. The temperature that we used was 57°C. 3. Once the annealing process is done, the temperature is raised to about 72°C and DNA polymerase then extends from the primers copying the DNA. 4. PCR then amplifies a segment of a DNA sequence. In the end, there will be two new DNA strands identical to the original strand.
Components of PCR Master Mix • A modified form of the enzyme Taq DNA polymerase that lacks 5´→3´ exonuclease activity. • dNTPs • MgCl2 • Colorless Reaction Buffer (pH 8.5)
Components of PCR Master Mix
Flourimeter Assembly Procedure 1. To assemble the flourimeter, first obtain smartphone to capture the picture needed during data collection. 2. Turn on the flourimeter and drop a single drop of solution onto the hydrophobic slide. 3. Turn the black box provided upside down to cover the flourimeter. 4. Set up the smartphone on the stand provided, and align the camera/phone about 3 inches in front of the flourimeter. Make sure that the stand and the flourimeter is covered directly under the black box.
You will have 8 samples from the OpenPCR instrument and 1 DNA (calf thymus standard at 2 micrograms/mL) sample and water from the scintillation vial to analyze. 1. With a permanent marker, number your transfer pipettes at the bulbs so that you only use if for one sample. With the permanent marker number your Eppendorf tubes at the top. At the end, you should have 10 Eppendorf tubes and 10 pipettes clearly labeled. 2. Transfer each sample seperatly (using one pipette per sample) into an Eppendorf tube containing 400 mL of buffer. Label this tube with the number of your sample. Get your entire sample into this Eppendorf tube. You can use this sample number transfer pipette to place only this sample drop onto the fluorescent measuring device. 3. Take the specially labeled Eppendorf tube containing Sybr Green I using the specifically labeled pipette only place two drops on the first two centered drops as seen on the video. 4. Now take your diluted sample and place two drops on top of the Syber Green I solution drops. 5. Align the light going through the drop, as seen in the video. 6. Let the smart-phone operator take as many pictures using the light box as he/she wants. 7. Now either rerun the sample again or discard that sample’s pipette. Keep the Sybr Green I labeled pipette. 8. You can run 5 samples per glass slide. 9. As the last sample run the water from the scintillation vial as a blank using the same procedure as with the other samples.
Our group used a Galaxy Nexus 1. After setting up the Flourimeter set a Smartphone’s photo settings to the ones listed.
2. Once the samples have been prepared, place the Flourimeter in the light box. 3. Take as many pictures as needed. Your goal is to take pictures clear enough so ImageJ can take data from the images. 4. Once you have taken enough photos of that sample give the Flourimeter back to the sample preparer to prepare the next sample. 5. Repeat this procedure for all the samples.
1. ImageJ was used to analyze the images taken by the smartphone. To upload the image onto ImageJ, the ANALYZE tab was clicked and SET MEASUREMENTS was chosen. AREA INTEGRATED DENSITY and MEAN GREY VALUE was selected from the menu. 2. The MENU tab was selected and COLOR was chosen, the function SPLIT CHANNELS was used; three separate files were created. SYBR GREEN fluoresces green, so the image name with "green" next to it was used. 3. The oval selection was used to draw an oval around the green drop. Then, MEASURE was selected from the ANALYZE tab, and the sample number and the numbers measured from the image was recorded. 4. To get the readings from the background of the image, another oval of the same size was drawn in the green image and MEASURE was selected from ANALYZE tab. The sample number and the numbers measured from the image was recorded, this data will be labeled as "background". 5. The measurements were saved in an excel file by clicking SAVED AS from the FILE tab.
Research and DevelopmentSpecific Cancer Marker Detection - The Underlying Technology PCR detection works by heating the DNA sample to about 110°C in order to split the DNA. Then the PCR cools off to 57°C in order for the primer to attach to the DNA strands. The PCR then heats to 72°C so the DNA strand can be re-written. The r17879961 cancer-associated sequence will produce a DNA signal because the reverse primer used, AACTCTTACACTCGATACAT will only attach if the DNA sample has the same coding with the cancer-associated sequence “ACT”. If the DNA sample does not have the cancer-associated sequence the primer will not attach and there will be no DNA signal. http://openwetware.org/images/3/39/Screen_Shot_2012-11-01_at_3.56.31_PM.png Source: http://openpcr.org/use-it/
Results
| |||||||||||||||||||||||||||||||||||||||||||||||||||||||||


