BME100 f2014:Group7 L2: Difference between revisions
| (8 intermediate revisions by 2 users not shown) | |||
| Line 31: | Line 31: | ||
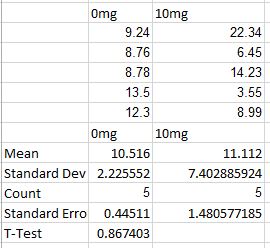
[[Image:BMEGroup7Data_Points_for_Rats.JPG|400px|Rat Data]] | [[Image:BMEGroup7Data_Points_for_Rats.JPG|400px|Rat Data]] | ||
The chart above shows the effect lipopolysaccharide has on the Inflammotin levels of rats. The inflammotin is measured in picograms per millilters and the values are used to calculate the mean, standard deviation, count, standard error, and T-test. | |||
<br> | <br> | ||
| Line 38: | Line 39: | ||
[[Image:BMEGroup7Data_Points_for_Humans.JPG|400px|Human Data]] | [[Image:BMEGroup7Data_Points_for_Humans.JPG|400px|Human Data]] | ||
This chart shows the effect Lipopolysaccharide has on the Inflammotin levels of humans. The Inflammotin is measured the same way as Experiment 1. | |||
<br><br> | <br><br> | ||
| Line 46: | Line 45: | ||
'''Experiment 1''' <br> | '''Experiment 1''' <br> | ||
[[Image:BMEGroup7Graph_-2.JPG|400px|Graph of RAts]] | |||
T-test: p-value = 0.867403 | T-test: p-value = 0.867403 | ||
| Line 51: | Line 54: | ||
'''Experiment 2''' <br> | '''Experiment 2''' <br> | ||
[[Image:BMEGroup7Graph_-1.JPG|400px|Graph of Humans]] | |||
[[Image:BMEGroup7Graph_-3.JPG|500px|Description of image]] | [[Image:BMEGroup7Graph_-3.JPG|500px|Description of image]] | ||
| Line 58: | Line 63: | ||
==Analysis== | ==Analysis== | ||
'''Selecting Tests:''' <br> | |||
Because there are only two groups of data that we are concerned with in the rat study, we used a student’s t-test to determine a p-value, which allows us to determine whether or not the data is statistically significant. The anlysis of variance (ANOVA) test is necessary for the human study because there are more than two sets of data, in this case there are four sets of data using the same units. | |||
'''Experiment 1''' <br> | '''Experiment 1''' <br> | ||
There is no statistical significance. As mentioned above in the “results” section, the T-test revealed a p-value of 0.867403. This means that we can only state that there was an effect from the LPS on the rats with 86.7% confidence, and for there must be 95% confindence for us to be able to accept our results as statistically significant. | |||
'''Experiment 2''' <br> | '''Experiment 2''' <br> | ||
There is a statistical significance seen through the ANOVA test which revealed a p-value of 1.4*10^-16. This means that between these four groups the means are equal showing a statistical significance which means that there is a low chance of getting results that are incorrect. | |||
<br><br> | <br><br> | ||
Latest revision as of 19:07, 16 September 2014
| Home People Lab Write-Up 1 | Lab Write-Up 2 | Lab Write-Up 3 Lab Write-Up 4 | Lab Write-Up 5 | Lab Write-Up 6 Course Logistics For Instructors Photos Wiki Editing Help | |||||||
|
OUR TEAM
LAB 2 WRITE-UPDescriptive StatisticsExperiment 1 The chart above shows the effect lipopolysaccharide has on the Inflammotin levels of rats. The inflammotin is measured in picograms per millilters and the values are used to calculate the mean, standard deviation, count, standard error, and T-test.
This chart shows the effect Lipopolysaccharide has on the Inflammotin levels of humans. The Inflammotin is measured the same way as Experiment 1.
ResultsExperiment 1
AnalysisSelecting Tests: Because there are only two groups of data that we are concerned with in the rat study, we used a student’s t-test to determine a p-value, which allows us to determine whether or not the data is statistically significant. The anlysis of variance (ANOVA) test is necessary for the human study because there are more than two sets of data, in this case there are four sets of data using the same units.
Experiment 1
There is a statistical significance seen through the ANOVA test which revealed a p-value of 1.4*10^-16. This means that between these four groups the means are equal showing a statistical significance which means that there is a low chance of getting results that are incorrect.
Summary/DiscussionBoth of these experiments were designed to test the effect of LPS on Inflammotin. In the first experiment, two groups of rats were tested with a control group at 0mg and the test group receiving 10mg of Lipopolysaccharide. The t-test revealed that there was no significant correlation between the levels of LPS and Inflammotin in rats (0.867 is less than 0.95). In the second experiment, four groups of humans were tested with levels of LPS including 0mg, 5mg, 10mg and 15mg. A single factor ANOVA test was run to determine whether or not the data revealed a statistically significant correlation between LPS and Inflammotin. Because the p-value returned from the anova test was nearly zero (1.4E-16) we can say with very high confidence that LPS does affect the level of Inflammotin in humans. If the human experiment had been conducted in the same manner as the rat study was, we would not have sufficient information to draw this conclusion. |
|||||||


