BME100 f2014:Group26 L3: Difference between revisions
No edit summary |
No edit summary |
||
| (93 intermediate revisions by 4 users not shown) | |||
| Line 25: | Line 25: | ||
==Introduction== | ==Introduction== | ||
Product design | Product design involves five main steps: Identifying a problem, investigating a solution, designing a prototype, testing the prototype, and finalizing the prototype for market availability. Spree Sports is a start-up company that has finalized a prototype for a headband, which is claimed to measure body temperature and heart rate accurately. The main goal of this lab was to test the effectiveness of and thus validate the Spree Headband in comparison to the gold standard in medicine. The Spree Headband is a device used to measure heart rate and body temperature while the user is exercising. To properly measure the effectiveness of the Spree Headband, the gold standard was used to test the heart rate and body temperature. Heart rate was measured by taking the pulse of a subject for 15 seconds, then multiplying the number by four to obtain the standard units of beats per minute. Body temperature was measured orally by using a thermometer. | ||
<br><br> | <br><br> | ||
==Changes Made to Raw Data== | ==Changes Made to Raw Data== | ||
In the raw data, | In the raw data, groups 22 and 25 listed their gold standard measurements of temperature in Celsius. These measurements were converted to Fahrenheit using the conversion factor, 1 degree C = 33.8 degrees F. All of the groups used the Spree Band measurements for temperature. These measurements were converted using the following scale: | ||
*Level 1 - 97 degrees F | |||
*Level 2 - 103 degrees F | |||
*Level 3 - 110 degrees F | |||
*Level 4 - 116 degrees F | |||
Groups 8 and 26 used the Spree Band scale to measure the heart rate; this number was not quantitative and was thus inapplicable. The paired data associated with these groups was removed from the data when analyzed. | |||
<br> | <br> | ||
| Line 42: | Line 47: | ||
==Graphing== | ==Graphing== | ||
*GS = Gold | *GS = Gold standard | ||
* | *Solid black line with a star above it = Statistically significant difference between sets of data | ||
'''Heart Rate''' | |||
[[Image:Lab 3A Heart Rate Graph.PNG]] | |||
'''Temperature''' | '''Temperature''' | ||
[[Image:Lab 3A Temperature Graph.PNG]] | [[Image:Lab 3A Temperature Graph.PNG]] | ||
'''Heart Rate''' | ==Inferential Statistics== | ||
A t-Test was used to compare the results of the Spree Band versus the gold standard for measuring heart rate and temperature because there were only two groups for each phase of the workout investigated: Spree Band (group 1) versus gold standard (group 2) for Indoor Pre-Walk, Walk, and Indoor Cool Down heart rate and temperature measurements. | |||
<br> The following are the t-Test values for '''Heart Rate''': | |||
*The t-Test value for the Indoor Pre-Walk is: 0.2969 | |||
*The t-Test value for the Walk is: 0.44866 | |||
*The t-Test value for the Indoor Cool Down is: 0.84484 | |||
<br> The following are the t-Test values for '''Temperature''': | <br> The following are the t-Test values for '''Temperature''': | ||
| Line 61: | Line 71: | ||
*The t-Test value for the Indoor Cool Down is: 3.9234E-95 | *The t-Test value for the Indoor Cool Down is: 3.9234E-95 | ||
------------------------------------------------------------------------------------------------------------------------------------------------------------- | |||
Pearson's r correlation coefficient was calculated for the heart rate and temperature measurements to see what type of correlation (positive, negative, or none) exists between the Spree Band's measurements and those of the gold standard. | |||
<br> | <br> The following are the Pearson's r correlation coefficient values for '''Heart Rate''': | ||
*The Pearson's r value for the Indoor Pre-Walk is: -0.010091 | |||
*The Pearson's r value for the Walk is: 0.133248 | |||
*The Pearson's r value for the Indoor Cool Down is: 0.219130 | |||
<br> The following are the Pearson's r correlation coefficient values for '''Temperature''': | <br> The following are the Pearson's r correlation coefficient values for '''Temperature''': | ||
| Line 77: | Line 87: | ||
*The Pearson's r value for the Indoor Cool Down is: -0.155259 | *The Pearson's r value for the Indoor Cool Down is: -0.155259 | ||
==Conclusions== | |||
The t-Test values for temperature were all below 0.05, meaning that there were statistically significant differences between the temperature measurements made by the Spree Band and the gold standard, which is problematic and thus makes the Spree Band an unreliable device for accurately measuring temperature during a workout. However, as the t-Test values for heart rate were all above 0.05 and thus did not have statistically significant differences, it is reasonable to say that the Spree Band is a reliable device to use as a heart rate monitor during a workout. In this experiment, counter to the norm, it was not good for a set of data to have t-Test values below 0.05 because this indicated that the results were statistically different, and thus, the Spree Band was not making measurements reflective of the gold standard, which is the trusted, reliable method of measuring the values at hand. | |||
== | |||
The t- | |||
==Experimental Errors== | ==Experimental Errors== | ||
The Spree Band had connectivity problems, where the measurements sometimes could not be taken at the appropriate time because the Spree Band was not interacting with the app.The Spree Band utilized a 1 to 4 scale, which had large information gaps and inexact measurements. The Spree Band also measured external body temperature, while the gold standard measured internal body temperature, which caused variability between readings. Lab groups 8, 11, and 26, specifically, measured the heart rate on the 1 to 4 scale (unlike the other lab groups) and therefore, had data that was not usable in the overall experiment. Limitations in the equipment available also contributed to errors, as lab group 26 did not have a properly working heart rate monitor and had to use the traditional method of determining pulse with the wrist as the gold standard. The number of beats could have been counted incorrectly, multiplied incorrectly, or taken incorrectly, as it is more exact to use a device to measure such values. The timing for the heart rate measurements could have been different as well. For an optimal experiment, the measurements using the Spree Band and the measurements using the gold standard should have been taken at precisely the same time; there is a possibility that this did not happen. | |||
<br><br> | <br><br> | ||
==Summary/Discussion== | ==Summary/Discussion== | ||
The experiment began by gathering all of our supplies | The experiment began by gathering all of our supplies, followed by the set up and syncing of our supplies. The supplies included a heart rate monitor, a thermometer, a Spree Headband with a sensor, and the Spree app. The first flaw encountered was the provided heart rate monitor, which turned out to be faulty. The monitor kept turning off and did not read the test subject's heart rate. We went through two different monitors, and each time, they were not successful in fixing our problem. We spent around twenty-five minutes trying to fix this problem. Our solution was manually measuring the test subject's heart rate by placing the pointer and middle fingers on one of the major veins in the wrist, setting a timer for fifteen seconds, and then multiplying our result by four to get the heart rate per minute. Once we came to the conclusion that the test subject's heart rate would need to be measured the old-fashioned way, we moved on to a much bigger problem. | ||
Our next problem | Our next problem involved our Spree Headband and app. The Spree Band was incredibly difficult to sync with the iPhone app, as there were so many other phones and devices in the room and building at the same time. It took us another twenty minutes to finally set the device up and take heart rate and temperature measurements. Next time, it might be easier to use a device that has either a wire that can connect to the phone or a device that does not have an app and just has a monitor on the headband itself, giving the data on the aforementioned monitor - This would be less complex and a much quicker method of measuring the heart rate and temperature measurements. The person using the Spree app had to walk behind the test subject the entire time to maintain a connection between the headband and the app, and even then, the connection was lost. Additionally, the heart rate on the Spree app was measured on a scale from 1-4, with each number representing a body temperature which was not accurate whatsoever, as some people had the number three turn out as a measurement, which was 110 degrees. If someone were to have a bodily temperature of 110, they would need to go to the hospital immediately for treatment for internal burning and a highly probable, serious infection. | ||
<br><br> | <br><br> | ||
| Line 99: | Line 103: | ||
==Target Population and Need== | ==Target Population and Need== | ||
YouVB ultraviolet protective contact lenses are the future of outdoor UV protection for amateur and professional fitness enthusiasts alike. Though athletes are the main target audience, this product is open and can be useful to a plethora of consumer groups: anybody who goes outside can benefit from YouVB. The eyes, which are extremely sensitive parts of the body, deteriorate constantly in the harmful rays emitted from the sun, thus making the UV protective properties of YouVB quintessential to the health of the eyes. Though the concept of UV protective contact lenses is not groundbreaking, YouVB contact lenses are. Many other companies, such as Acuvue, YouVB's primary competitor, receive complaints from consumers regarding the irritation that their thick, UV protecting contact lenses cause after just a couple hours of wear. This discomfort causes many customers to leave their contacts at home, inviting damaging rays into their eyes. Additionally, Acuvue contact lenses are suggested to be worn for two weeks maximum. YouVB Contact Lenses can be worn for up to a month, which means that they cost less for the consumer. The need for comfortable yet safe, protective contact lenses has reached an all-time high, and YouVB is here to change that. Thinner than any other contacts on the market, YouVB contact lenses guarantee comfort. In addition to a higher rate of protection, YouVB is also equipped with a dehydration monitor that changes color when the user's osmolality levels reach above the normal range of 275-295 mOsm/kg. YouVB's myriad features on top of convenience and comfort easily meet consumer needs for new and improved UV protective contact lenses. | |||
==Device Diagram== | |||
'''YouVB Contact Lens - Hydrated State''' | |||
[[Image:Lab 3B Hydrated YouVB Diagram.png]] | |||
<br> | |||
'''YouVB Contact Lens - Dehydrated State''' | |||
[[Image:Lab 3B Dehydrated YouVB Diagram.png]] | |||
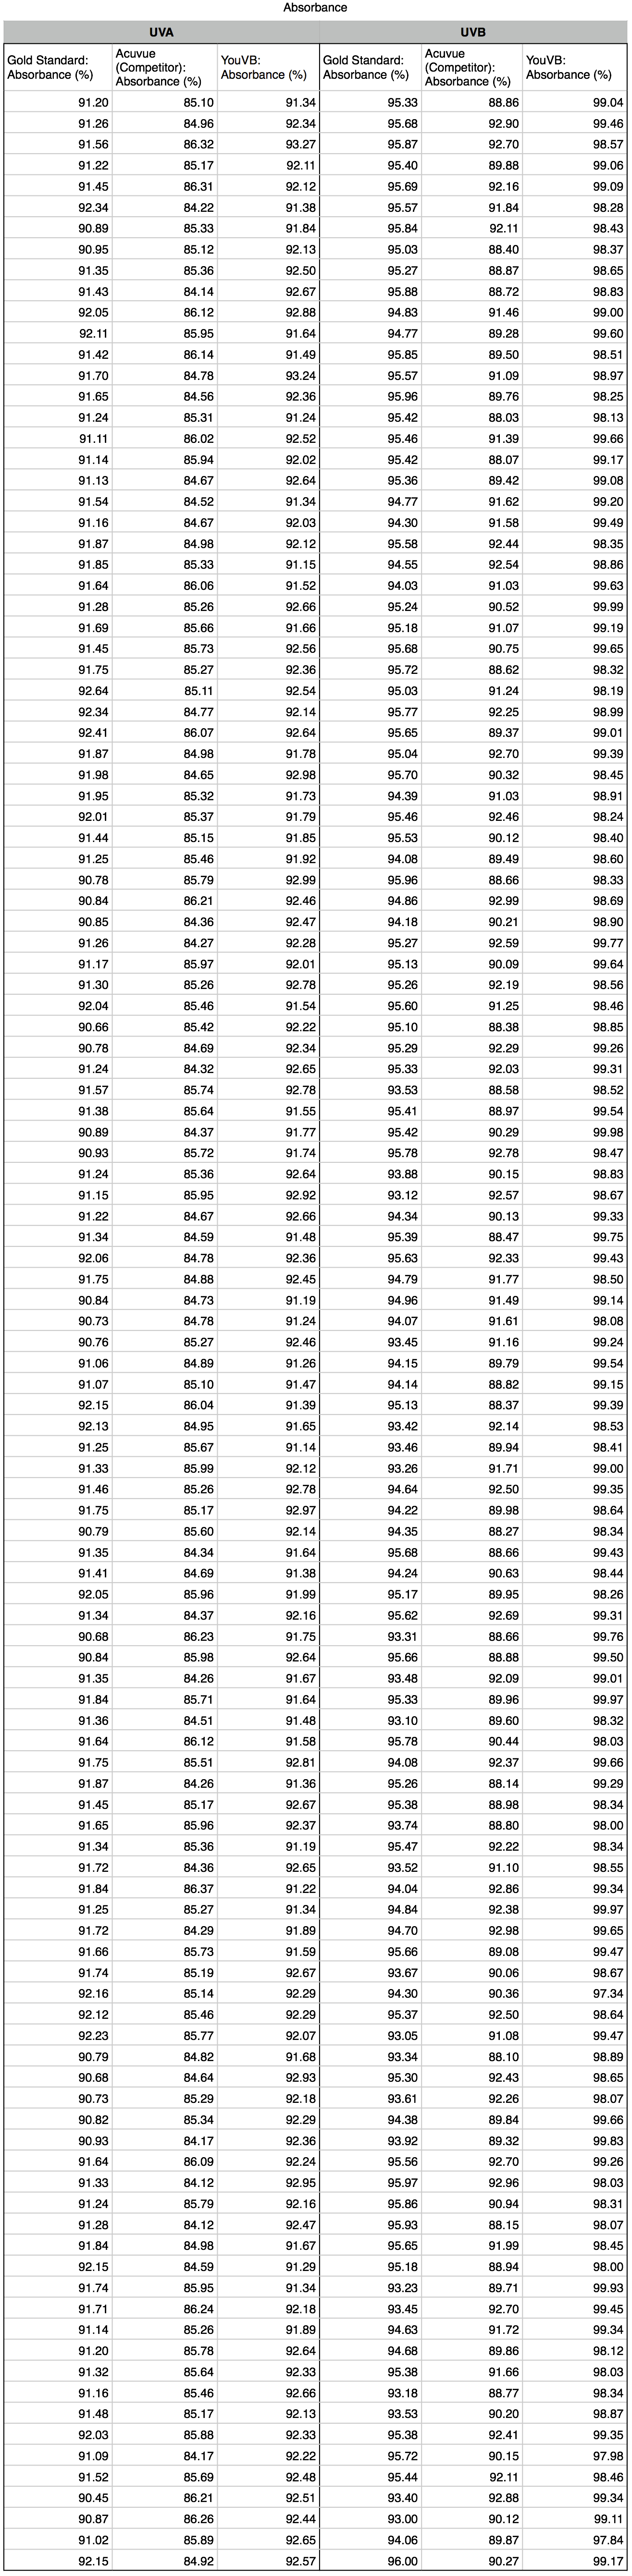
==Raw Data== | |||
*View the [http://openwetware.org/images/f/f1/Osmolality_Raw_Data_Image_Final.jpg osmolality data] or the [http://openwetware.org/images/8/81/Absorbance_Raw_Data_Image.jpg absorbance data] in full resolution | |||
The | [[Image:Osmolality_Raw_Data_Image_Final.jpg|300px|]] [[Image:Absorbance_Raw_Data_Image.jpg|465px]] | ||
< | |||
==Descriptive Statistics== | |||
[[Image: Osmolality_Descriptive_Stats_Image.jpg|center|600px]] | |||
[[Image:Absorbance_Descriptive_Stats_Image.jpg|center|800px]] | |||
==Inferential Statistics== | |||
<span style="color:orange">'''Inferential Statistics for Osmolality Measurements'''</span> | |||
<span style="color:orange">'''''t-Test Values:'''''</span> | |||
Dehydrated Osmolality: 0.969807 <br> | |||
Hydrated Osmolality: 0.991136 | |||
The t-Test values for the dehydrated and hydrated osmolality measurements between the gold standard and YouVB are well above 0.05, which, counter to the norm, is ideal in this case. Having a t-Test value above 0.05 means that the measurements taken between the gold standard and YouVB do not have a statistically significant difference, meaning the YouVB reflects the measurements of the gold standard accurately and is thus highly valid. | |||
<span style="color:orange">'''''Pearson's r Values:'''''</span> | |||
Dehydrated Osmolality: 0.999785 <br> | |||
Hydrated Osmolality: 0.986557 | |||
The Pearson's r value is used to determine the type of relationship (positive, negative, or none) that exists between YouVB VS. gold standard osmolality values for hydration and dehydration. The values indicate that there is a positive correlation; this means the YouVB product matches the values of the gold standard. The r values are very close to 1.0, indicating there is a substantially close match between the measurements made between the gold standard and the YouVB, and that the device has a high degree of validity. | |||
------------------------------------------------------------------------------------------------------------------------------------------------------------- | |||
<span style="color:blue">'''Inferential Statistics for Absorbance Measurements'''</span> | |||
<span style="color:blue">'''''ANOVA Test Results for UVA Absorbance'''''</span> | |||
[[Image:Lab 3B UVA Absorbance ANOVA Test.PNG]] | |||
<span style="color:blue">'''''ANOVA Test Results for UVB Absorbance'''''</span> | |||
[[Image:Lab 3B UVB Absorbance ANOVA Test.PNG]] | |||
<span style="color:blue">'''''Bonferroni Correction Post-Hoc Tests for UVA Absorbance'''''</span> | |||
[[Image:Lab 3B UVA Absorbance Bonferroni Correction Post-Hoc Tests.PNG]] | |||
The Post-Hoc Tests for UVA Absorbance indicate that there are statistically significant differences between the gold standard VS. Acuvue, gold standard VS. YouVB, and Acuvue VS. YouVB comparisons. The fact that the t-Test value for the gold standard VS. YouVB comparison is higher than that of the gold standard VS. Acuvue comparison indicates that the gold standard and YouVB groups have less of a statistically significant difference between them than the gold standard and Acuvue groups. This is significant in this case because it means that the YouVB measures UVA absorbance measurements that are more reflective of the gold standard than does Acuvue. The statistically significant difference between the Acuvue and YouVB groups is essential in demonstrating how the YouVB is superior to its competitors, as the extremely low t-Test value indicates that the YouVB would absorb UVA light to a much higher degree than Acuvue on a substantial amount of occasions (or if the measurements were to be taken multiple times). | |||
<span style="color:blue">'''''Bonferroni Correction Post-Hoc Tests for UVB Absorbance'''''</span> | |||
[[Image:Lab 3B UVB Absorbance Bonferroni Correction Post-Hoc Tests.PNG]] | |||
The Post-Hoc Tests for UVB Absorbance also indicate that there are statistically significant differences between the gold standard VS. Acuvue, gold standard VS. YouVB, and Acuvue VS. YouVB comparisons. Although the t-Test value for the gold standard VS. Acuvue comparison is higher than that of the gold standard VS. YouVB comparison, the gold standard absorbs less UVB light than the YouVB, which means that having a higher t-Test value (and thus a lesser degree of a statistically significant difference) is not as beneficial in terms of absorbing UVB light. Again, the YouVB proves to be superior to its competitors, as its t-Test value calculated in the Acuvue VS. YouVB comparison demonstrates that there indeed is a statistically significant difference between the measurements made by Acuvue and YouVB and thusly that YouVB absorbs UVB light to a statistically-demonstrated, significantly-higher degree than Acuvue does. The YouVB's heightened abilities to absorb UVB light is particularly valuable, as UVB is the more powerful ultraviolet wavelength that is transmitted to the Earth (out of UVA and UVB; UVC is not transmitted to the Earth, as the atmosphere absorbs UVC completely). | |||
The | |||
== | ==Graphing== | ||
*Solid black line with a star above it = Statistically significant difference between sets of data | |||
'''Dehydrated Osmolality''' | |||
[[Image:Lab 3B Dehydrated Osmolality Graph.PNG]] | |||
'''Hydrated Osmolality''' | |||
[[Image:Lab 3B Hydrated Osmolality Graph.PNG]] | |||
'''UVA Absorbance''' | |||
[[Image:Lab 3B UVA Absorbance Graph.PNG]] | |||
'''UVB Absorbance''' | |||
[[Image:Lab 3B UVB Absorbance Graph.PNG]] | |||
== | ==Commercial== | ||
*View the commercial for YouVB Contact Lenses at https://www.youtube.com/watch?v=cQSDAEo3YLs | |||
Latest revision as of 23:59, 14 October 2014
| Home People Lab Write-Up 1 | Lab Write-Up 2 | Lab Write-Up 3 Lab Write-Up 4 | Lab Write-Up 5 | Lab Write-Up 6 Course Logistics For Instructors Photos Wiki Editing Help | |||||||
|
OUR TEAM
LAB 3A WRITE-UPIntroductionProduct design involves five main steps: Identifying a problem, investigating a solution, designing a prototype, testing the prototype, and finalizing the prototype for market availability. Spree Sports is a start-up company that has finalized a prototype for a headband, which is claimed to measure body temperature and heart rate accurately. The main goal of this lab was to test the effectiveness of and thus validate the Spree Headband in comparison to the gold standard in medicine. The Spree Headband is a device used to measure heart rate and body temperature while the user is exercising. To properly measure the effectiveness of the Spree Headband, the gold standard was used to test the heart rate and body temperature. Heart rate was measured by taking the pulse of a subject for 15 seconds, then multiplying the number by four to obtain the standard units of beats per minute. Body temperature was measured orally by using a thermometer.
Changes Made to Raw DataIn the raw data, groups 22 and 25 listed their gold standard measurements of temperature in Celsius. These measurements were converted to Fahrenheit using the conversion factor, 1 degree C = 33.8 degrees F. All of the groups used the Spree Band measurements for temperature. These measurements were converted using the following scale:
Groups 8 and 26 used the Spree Band scale to measure the heart rate; this number was not quantitative and was thus inapplicable. The paired data associated with these groups was removed from the data when analyzed.
Descriptive Statistics
Graphing
Heart Rate
Temperature
Inferential StatisticsA t-Test was used to compare the results of the Spree Band versus the gold standard for measuring heart rate and temperature because there were only two groups for each phase of the workout investigated: Spree Band (group 1) versus gold standard (group 2) for Indoor Pre-Walk, Walk, and Indoor Cool Down heart rate and temperature measurements.
Pearson's r correlation coefficient was calculated for the heart rate and temperature measurements to see what type of correlation (positive, negative, or none) exists between the Spree Band's measurements and those of the gold standard.
ConclusionsThe t-Test values for temperature were all below 0.05, meaning that there were statistically significant differences between the temperature measurements made by the Spree Band and the gold standard, which is problematic and thus makes the Spree Band an unreliable device for accurately measuring temperature during a workout. However, as the t-Test values for heart rate were all above 0.05 and thus did not have statistically significant differences, it is reasonable to say that the Spree Band is a reliable device to use as a heart rate monitor during a workout. In this experiment, counter to the norm, it was not good for a set of data to have t-Test values below 0.05 because this indicated that the results were statistically different, and thus, the Spree Band was not making measurements reflective of the gold standard, which is the trusted, reliable method of measuring the values at hand. Experimental ErrorsThe Spree Band had connectivity problems, where the measurements sometimes could not be taken at the appropriate time because the Spree Band was not interacting with the app.The Spree Band utilized a 1 to 4 scale, which had large information gaps and inexact measurements. The Spree Band also measured external body temperature, while the gold standard measured internal body temperature, which caused variability between readings. Lab groups 8, 11, and 26, specifically, measured the heart rate on the 1 to 4 scale (unlike the other lab groups) and therefore, had data that was not usable in the overall experiment. Limitations in the equipment available also contributed to errors, as lab group 26 did not have a properly working heart rate monitor and had to use the traditional method of determining pulse with the wrist as the gold standard. The number of beats could have been counted incorrectly, multiplied incorrectly, or taken incorrectly, as it is more exact to use a device to measure such values. The timing for the heart rate measurements could have been different as well. For an optimal experiment, the measurements using the Spree Band and the measurements using the gold standard should have been taken at precisely the same time; there is a possibility that this did not happen.
Summary/DiscussionThe experiment began by gathering all of our supplies, followed by the set up and syncing of our supplies. The supplies included a heart rate monitor, a thermometer, a Spree Headband with a sensor, and the Spree app. The first flaw encountered was the provided heart rate monitor, which turned out to be faulty. The monitor kept turning off and did not read the test subject's heart rate. We went through two different monitors, and each time, they were not successful in fixing our problem. We spent around twenty-five minutes trying to fix this problem. Our solution was manually measuring the test subject's heart rate by placing the pointer and middle fingers on one of the major veins in the wrist, setting a timer for fifteen seconds, and then multiplying our result by four to get the heart rate per minute. Once we came to the conclusion that the test subject's heart rate would need to be measured the old-fashioned way, we moved on to a much bigger problem. Our next problem involved our Spree Headband and app. The Spree Band was incredibly difficult to sync with the iPhone app, as there were so many other phones and devices in the room and building at the same time. It took us another twenty minutes to finally set the device up and take heart rate and temperature measurements. Next time, it might be easier to use a device that has either a wire that can connect to the phone or a device that does not have an app and just has a monitor on the headband itself, giving the data on the aforementioned monitor - This would be less complex and a much quicker method of measuring the heart rate and temperature measurements. The person using the Spree app had to walk behind the test subject the entire time to maintain a connection between the headband and the app, and even then, the connection was lost. Additionally, the heart rate on the Spree app was measured on a scale from 1-4, with each number representing a body temperature which was not accurate whatsoever, as some people had the number three turn out as a measurement, which was 110 degrees. If someone were to have a bodily temperature of 110, they would need to go to the hospital immediately for treatment for internal burning and a highly probable, serious infection.
LAB 3B WRITE-UPTarget Population and NeedYouVB ultraviolet protective contact lenses are the future of outdoor UV protection for amateur and professional fitness enthusiasts alike. Though athletes are the main target audience, this product is open and can be useful to a plethora of consumer groups: anybody who goes outside can benefit from YouVB. The eyes, which are extremely sensitive parts of the body, deteriorate constantly in the harmful rays emitted from the sun, thus making the UV protective properties of YouVB quintessential to the health of the eyes. Though the concept of UV protective contact lenses is not groundbreaking, YouVB contact lenses are. Many other companies, such as Acuvue, YouVB's primary competitor, receive complaints from consumers regarding the irritation that their thick, UV protecting contact lenses cause after just a couple hours of wear. This discomfort causes many customers to leave their contacts at home, inviting damaging rays into their eyes. Additionally, Acuvue contact lenses are suggested to be worn for two weeks maximum. YouVB Contact Lenses can be worn for up to a month, which means that they cost less for the consumer. The need for comfortable yet safe, protective contact lenses has reached an all-time high, and YouVB is here to change that. Thinner than any other contacts on the market, YouVB contact lenses guarantee comfort. In addition to a higher rate of protection, YouVB is also equipped with a dehydration monitor that changes color when the user's osmolality levels reach above the normal range of 275-295 mOsm/kg. YouVB's myriad features on top of convenience and comfort easily meet consumer needs for new and improved UV protective contact lenses. Device DiagramYouVB Contact Lens - Hydrated State
Raw Data
Descriptive Statistics  Inferential StatisticsInferential Statistics for Osmolality Measurements t-Test Values: Dehydrated Osmolality: 0.969807 The t-Test values for the dehydrated and hydrated osmolality measurements between the gold standard and YouVB are well above 0.05, which, counter to the norm, is ideal in this case. Having a t-Test value above 0.05 means that the measurements taken between the gold standard and YouVB do not have a statistically significant difference, meaning the YouVB reflects the measurements of the gold standard accurately and is thus highly valid. Pearson's r Values: Dehydrated Osmolality: 0.999785 The Pearson's r value is used to determine the type of relationship (positive, negative, or none) that exists between YouVB VS. gold standard osmolality values for hydration and dehydration. The values indicate that there is a positive correlation; this means the YouVB product matches the values of the gold standard. The r values are very close to 1.0, indicating there is a substantially close match between the measurements made between the gold standard and the YouVB, and that the device has a high degree of validity. Inferential Statistics for Absorbance Measurements ANOVA Test Results for UVA Absorbance
The Post-Hoc Tests for UVA Absorbance indicate that there are statistically significant differences between the gold standard VS. Acuvue, gold standard VS. YouVB, and Acuvue VS. YouVB comparisons. The fact that the t-Test value for the gold standard VS. YouVB comparison is higher than that of the gold standard VS. Acuvue comparison indicates that the gold standard and YouVB groups have less of a statistically significant difference between them than the gold standard and Acuvue groups. This is significant in this case because it means that the YouVB measures UVA absorbance measurements that are more reflective of the gold standard than does Acuvue. The statistically significant difference between the Acuvue and YouVB groups is essential in demonstrating how the YouVB is superior to its competitors, as the extremely low t-Test value indicates that the YouVB would absorb UVA light to a much higher degree than Acuvue on a substantial amount of occasions (or if the measurements were to be taken multiple times). Bonferroni Correction Post-Hoc Tests for UVB Absorbance
The Post-Hoc Tests for UVB Absorbance also indicate that there are statistically significant differences between the gold standard VS. Acuvue, gold standard VS. YouVB, and Acuvue VS. YouVB comparisons. Although the t-Test value for the gold standard VS. Acuvue comparison is higher than that of the gold standard VS. YouVB comparison, the gold standard absorbs less UVB light than the YouVB, which means that having a higher t-Test value (and thus a lesser degree of a statistically significant difference) is not as beneficial in terms of absorbing UVB light. Again, the YouVB proves to be superior to its competitors, as its t-Test value calculated in the Acuvue VS. YouVB comparison demonstrates that there indeed is a statistically significant difference between the measurements made by Acuvue and YouVB and thusly that YouVB absorbs UVB light to a statistically-demonstrated, significantly-higher degree than Acuvue does. The YouVB's heightened abilities to absorb UVB light is particularly valuable, as UVB is the more powerful ultraviolet wavelength that is transmitted to the Earth (out of UVA and UVB; UVC is not transmitted to the Earth, as the atmosphere absorbs UVC completely). Graphing
Dehydrated Osmolality
Hydrated Osmolality
UVA Absorbance
UVB Absorbance
Commercial
|
|||||||


