BME100 f2014:Group25 L2
| Home People Lab Write-Up 1 | Lab Write-Up 2 | Lab Write-Up 3 Lab Write-Up 4 | Lab Write-Up 5 | Lab Write-Up 6 Course Logistics For Instructors Photos Wiki Editing Help | |||||||
|
OUR TEAM
LAB 2 WRITE-UPDescriptive Statistics
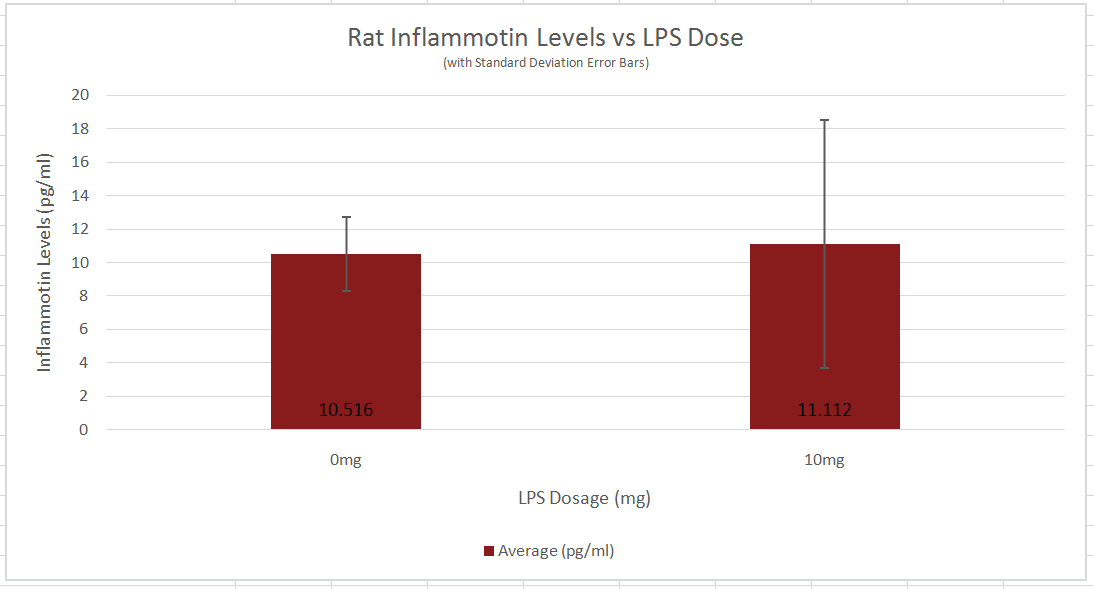
Human Raw Data Set Rat Raw Data Set ResultsThe ANOVA test showed that our data contained negligible amounts of variance and our measurements were precise. Furthermore, our t-test values were incredibly small. This disproves the null hypothesis and leads us to believe that there is a relationship between the dosage of LPS and levels of inflammotin in the body. The data collected from the rats that were given dosages of LPS showed no apparent relationship between how much of the protein they received and the levels of inflammotin in their body. Furthermore, the p-value from the t-test performed on the data supports the null hypothesis and suggests that there is not a relationship between how much LPS is given to the rats and the levels of inflammotin in the body afterwards.
AnalysisHuman ANOVA Analysis Rat 2-variable t-test The 2-variable t-test used to analyze the data of the rat portion of the experiment yielded a p-value of 0.8674035. Since this calculated value is far greater than the established normal confidence factor of 0.05, there is no significance in Inflammotin levels between the 0 and 10 milligram dosages of LPS. This can be further witnessed in the above bar graph which show the overlap in standard deviation error bars. As a result, the null hypothesis must be accepted and thus, the alternative hypothesis rejected. The 2-variable t-test was chosen to serve as the statistical analysis tool to compare the Inflammotin level after different dosages of LPS were administered because this portion of the experiment only had two different groups. More specifically, the version of the t-test used was unpaired because the two groups of rats were taken to be from a total of ten rats so each group of five rats were unique. Had the experimenter decided to use a group of ten rats in two trials, a paired t-test would have been implemented instead.
Summary/DiscussionWith the Human Testing of LSP on Inflammotin levels, Inflammotin increased dramatically, over the increase of dosage, peaking with an almost 9 fold increase from 10 to 15 mg dose. As the p-value for the between group variance was 1.4*10^-16, the results for the Human tests were significant, and conclusive. The p-values between each dosage group for the Human tests were also significant, as the values were below 0.05, or the 5% likelihood that the results occurred strictly by chance. In humans the data was also very precise and had negligible amounts of variance; the t-test values were also small. There is enough evidence to be able to reject the null hypothesis and accept the alternate hypothesis establishing that a relationship exists between the independent (LSP) and dependent variables (Inflammotin levels) for humans. However contrary to the human tests, which were highly conclusive and showed a dramatic change of Inflammotin levels as the dosage of LSP is increased, the rat tests were far less conclusive. The p-value of the rat tests between the doses is 0.87, which indicates that the results are very likely to have come simply from pure chance, rather than an effect of LSP on Inflammotin levels. There is not enough evidence to be able to reject the null hypothesis and establish that a relationship between the independent (LSP) and dependent variables (Inflammotin levels) exists for rats. The rat's base Inflammotin levels were around 10 pg/mL, while the human's base Inflammotin levels were around 4 pg/mL. The rat's Inflammotin levels did not seem to be affected by the drug, LSP; however no significant statements can be made about LSP's effect on Inflammotin levels in rats, as their Inflammotin values were not consistent in any way and the p-value is far larger than 0.05. |
|||||||


