BME100 f2013:W1200 Group9 L5: Difference between revisions
Kenna M. Lum (talk | contribs) |
|||
| Line 47: | Line 47: | ||
* Type of Smartphone: Samsung Galaxy S4 | * Type of Smartphone: Samsung Galaxy S4 | ||
** Flash: off | ** Flash: off | ||
** ISO setting: | ** ISO setting: 800 | ||
** White Balance: | ** White Balance: Auto | ||
** Exposure: | ** Exposure:+2.00 | ||
** Saturation: | ** Saturation:N/A | ||
** Contrast: | ** Contrast:N/A | ||
Revision as of 14:09, 6 November 2013
| Home People Lab Write-Up 1 | Lab Write-Up 2 | Lab Write-Up 3 Lab Write-Up 4 | Lab Write-Up 5 | Lab Write-Up 6 Course Logistics For Instructors Photos Wiki Editing Help | ||||||||||||||||||
OUR TEAM
LAB 5 WRITE-UPBackground InformationSYBR Green Dye
ProcedureSmart Phone Camera Settings
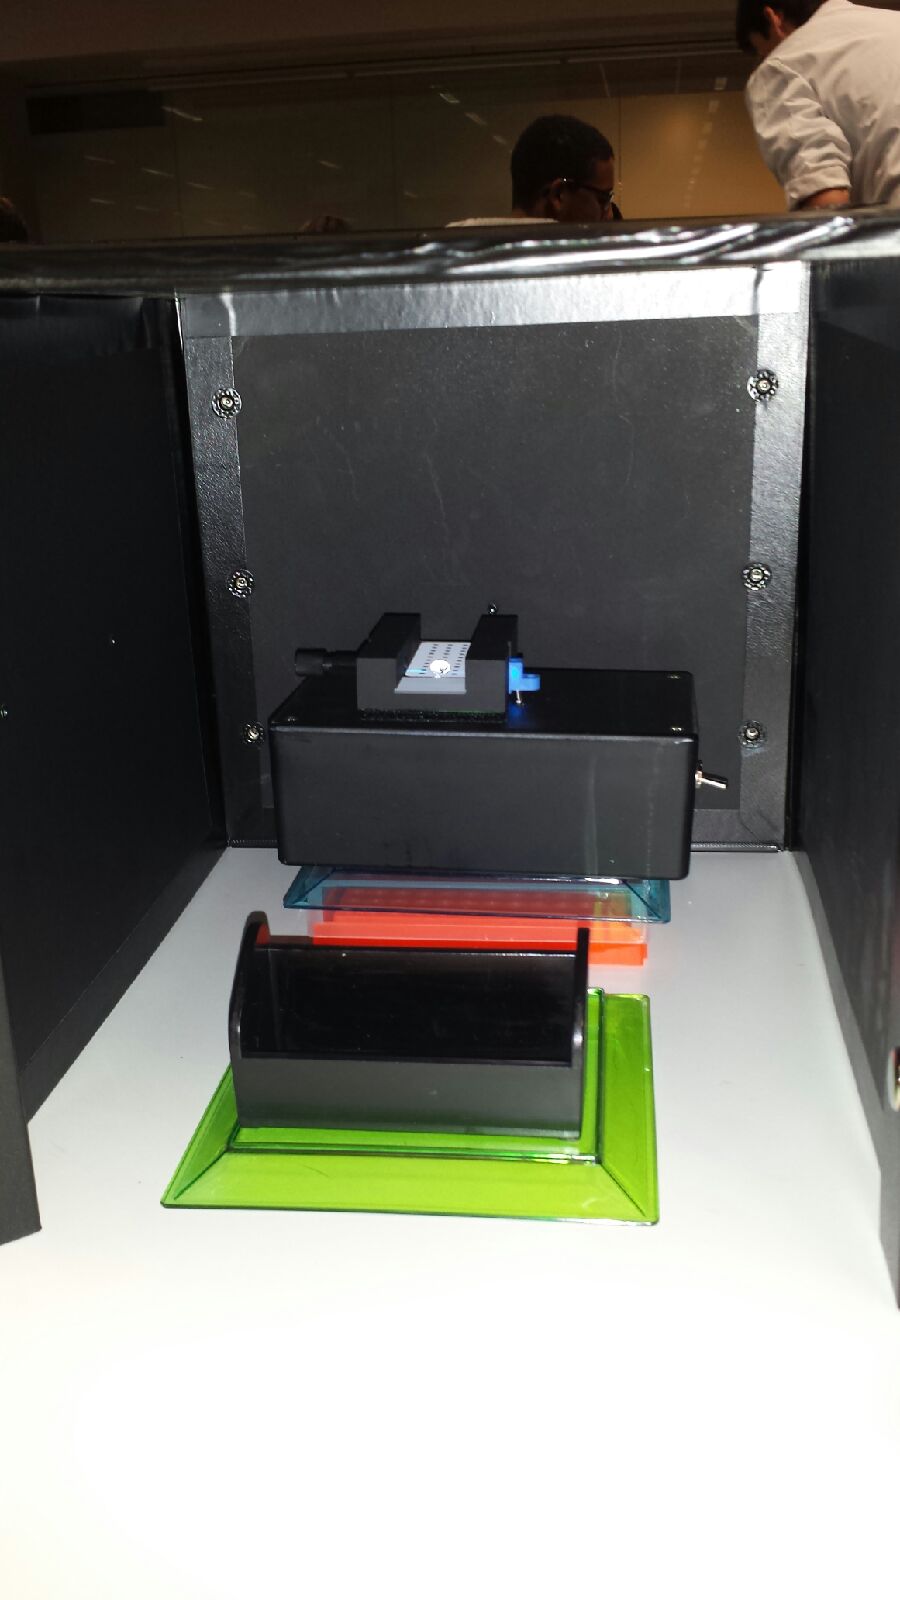
To set up the experiment, the slide was placed smooth side down in the fluorimeter. The height of the device was adjusted so that the camera, when placed in the cradle, would be able to take a photo of the drop from a side view. From there, the light was turned on and the 80 uL of SYBR Green I solution was placed in between the two first dots in the middle column. We then added 80 uL of the sample/calibration solution to the 80 uL of SYBR Green I, so that there was a drop with a total volume of 160 uL. With the light centered, and the cradle 9 cm away from the center of the drop, we took 3 pictures per drop. We repeated the steps again for another sample of the same concentration, to total 2 trials with 3 pictures each. These steps were then repeated for each of the 6 concentrations: 0, .25, .5, 1, 2, and 5.
[Instructions: See worksheet page 6.]
[Add more rows as needed]
Data AnalysisRepresentative Images of Samples [Instructions: Show an IMAGE where you drew a circle around the droplet with the freehand tool for a sample with no DNA] [Instructions: Show an IMAGE where you drew a circle around the droplet with the freehand tool for a sample with DNA (positive signal)]
Image J Values for All Samples [Instructions: See worksheet page 8. To save time on typing a new Wiki table from scratch, use THIS TOOL to auto-generate a Wiki table: Excel-to-Wiki Converter. Copy the headers and values from the Excel spreadsheet you made, paste them into the form field, click submit, copy the Wiki code that the tool generated, and replace TABLE GOES HERE (below) with your auto-generated code.]
[Instructions: Place an IMAGE of your Excel plot with a line of best fit here. See worksheet page 9]
|
||||||||||||||||||

