BME100 f2013:W1200 Group18 L3: Difference between revisions
| Line 64: | Line 64: | ||
==Analysis== | ==Analysis== | ||
<big><big><b>T Tests</b></big></big><br> | <big><big><b>T Tests</b></big></big><br> | ||
[[Image:analysis.png]] | |||
[[Image:Lab3ttestoutside.PNG]] | [[Image:Lab3ttestoutside.PNG]] | ||
Revision as of 13:38, 25 September 2013
| Home People Lab Write-Up 1 | Lab Write-Up 2 | Lab Write-Up 3 Lab Write-Up 4 | Lab Write-Up 5 | Lab Write-Up 6 Course Logistics For Instructors Photos Wiki Editing Help | |||||||
|
OUR TEAM
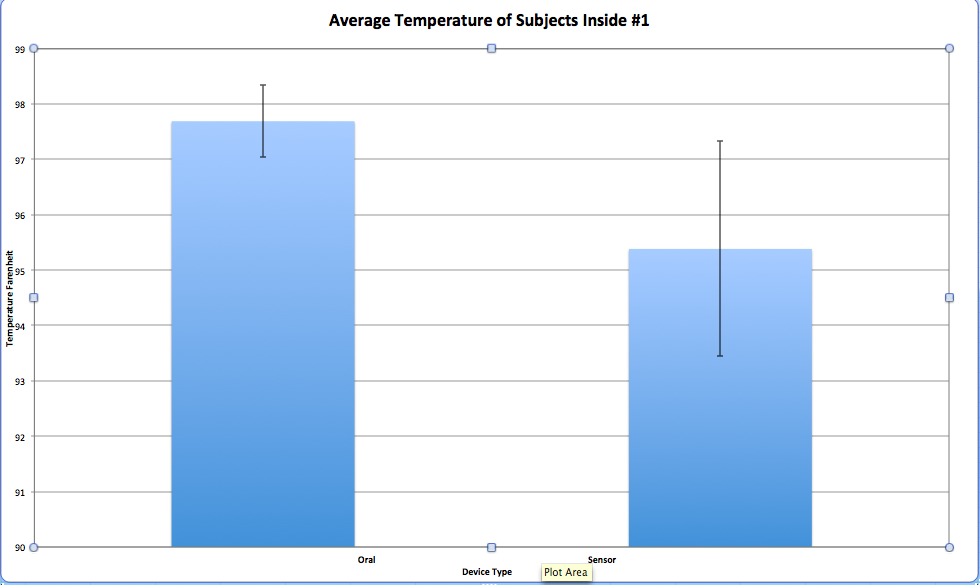
LAB 3A WRITE-UPDescriptive StatisticsInside #1: Outside: Inside #2:
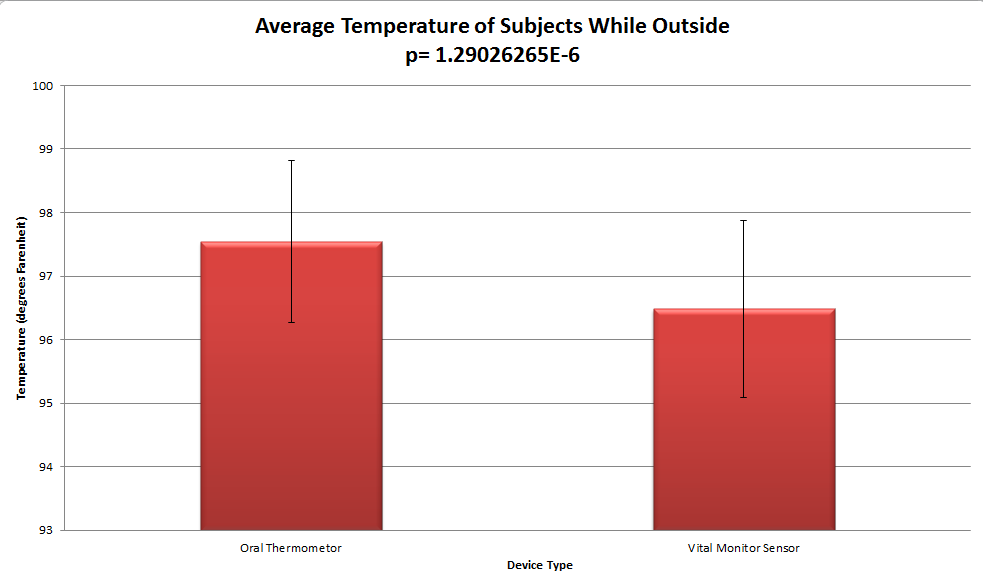
Results(Well-labeled graph with error bars and significance)
AnalysisPearson's r Correlation
Summary/DiscussionA thermometer manufactured by Raiing claims to have the ability to measure temperature then wirelessly communicate the results to a smart phone with pristine accuracy. In order to test whether or not it's worth the eighty dollars to purchase and receive a correct reading, our group will test the measure of the sensor thermometer against the measure of an oral thermometer over a period of time. Testing the two simultaneously should reveal whether or not having a device like the wireless thermometer is even beneficial. If the two aren't showing the same relative reading, then it can be concluded that the sensor is not as accurate as Raiing claims it to be.
LAB 3B WRITE-UPTarget Population and Need
Device Design
Inferential Statistics
Graph
| |||||||


