BIOL368/F14:Isabel Gonzaga Week 9
HIV Structure Project
Defining Your HIV Structure Research Project
This research project will be completed in conjunction with Nicole Anguiano and Chloe Jones.
Question
How does the structure of the V3 protein region affect the HIV status (diagnosed, progressing or non-trending) of the patient?
Hypothesis
We hypothesize that diagnosed groups will express greater variability in the V3 region in their protein structure, in comparison to the non-trending groups. Initial comparisons show that diagnosed groups and progressing groups expressed greater genetic variability than non-trending groups. These changes may affect the third variable region, affecting the host's ability to adapt to the changes and generate sufficient immune response.
Subject Data
According to the BEDROCK HIV Sequence Data Table, I was able to determine which of the subjects used within my study actually developed aids. All 3 AIDS diagnosed were confirmed with the disease by their final visit. In the AIDS progressing groups, subjects developed AIDS within 1 year after their final visit. The Non-Trending groups all maintained high CD4 T Cell Counts above the threshold, even after the study was conducted. Sequences were for each visit and subject were chosen using a Random Integer Generator, to eliminate selection bias.
The following sequences was taken from the BEDROCK HIV Problem Space Database, from the Markham et al. (1998) study.
Table 1: Sequences analyzed
| Group | Subject | Visit | Sequences |
|---|---|---|---|
| AIDS Diagnosed | 3 10 15 |
1 6 1 6 1 4 |
1, 2, 4 3, 4, 5 3, 6, 7 2, 4, 8 2, 3, 4 5, 8, 10 |
| AIDS Progressing | 7 8 14 |
1 5 1 7 1 9 |
2, 3, 9 2, 8, 9 1, 4, 5 1, 6, 7 2, 3, 4 9, 10, 11 |
| No Trend | 5 6 13 |
1 5 1 9 1 5 |
1, 3, 8 4, 5, 2 1, 2, 3 6, 7, 9 1, 3, 4 3, 5, 4 |
Protein sequences for each data set were taken from BEDROCK HIV Problem Space and converted to the following .txt files using word processor programs:
- AIDS Diagnosed Sequences
- AIDS Progressing Sequences
- [[Media:|No Trend Sequences]].
DNA sequences for each data were also taken from BEDROCK HIV Problem Space and converted to the following .txt files: [[Media:|AIDS Diagnosed Sequences]], AIDS Progressing Sequences, [[Media:|No Trend Sequences]].
Protein Sequence Multiple Sequence Alignment
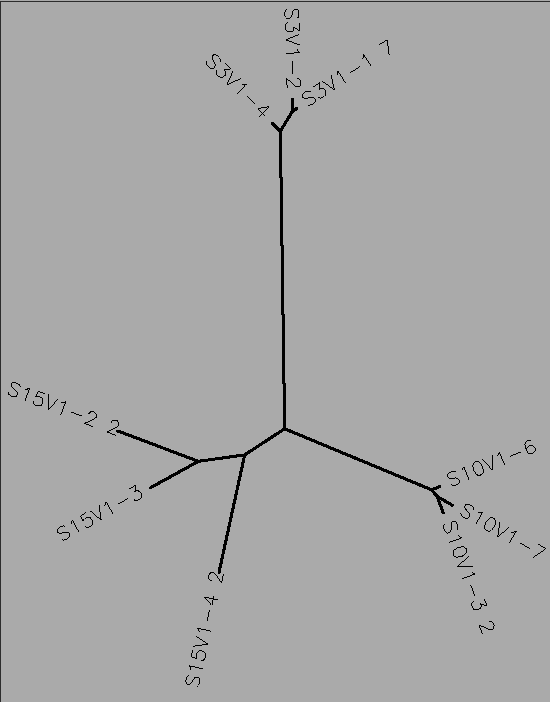
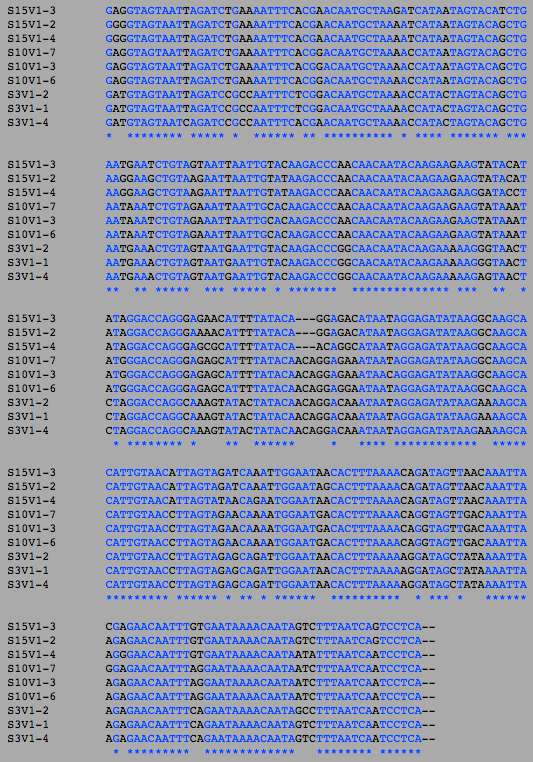
ClustalW was performed for each group category from Visit 1 under the Biology Workbench Protein tools. Rootless phylogenetic trees were analyzed, and the multiple sequence alignment was conducted. This alignment was used to determine diversity within each category at each amino acid residue. ClustalW was also performed for each group category from the final visit.
Multiple Sequence alignment was also used to compare differences between amino acid sequences and DNA sequences. The DNA sequences for each clone was uploaded onto Biology Workbench under the 'nucleic tools' tab. ClustalW was performed for each group category three times: for visit 1, final visit and both visits combined.
There seem to be fewer differences between the amino acid sequences compared to the DNA sequences. This is likely due to the redundancy of the degenerate genetic code (ie. different combinations of DNA sequences form different codons that code for the same amino acid residue).
Protein sequence alignments were downloaded as a .txt file for further analysis. The alignments can be found here:
Diagnosed Group Multiple Sequence Alignments


Progressing Group Multiple Sequence Alignments


Non-trending Group Multiple Sequence Alignments


DNA Sequence Multiple Sequence Alignment
AIDS Diagnosed Groups


| Visit | Type | Number of Differences | Percentage Different |
|---|---|---|---|
| 1 | Amino Acids | 37 | 37/95 = 38.9% |
| 1 | DNA | 69 | 69/285 = 24.2% |
| Final | Amino Acids | 45 | 45/95 = 47.3% |
| Final | DNA | 79 | 79/285 = 27.7% |
| Both | Amino Acids | 49 | 49/95 = 51.6% |
| Both | DNA | 94 | 94/285 = 33% |
Table 2. Table illustrating the number of differences between the amino acid sequences and the DNA sequences at both visits.
AIDS Progressing Groups


Sequence Differences Between Progressor Groups
| Visit | Type | Number of Differences | Percentage Different |
|---|---|---|---|
| 1 | Amino Acids | 31 | 31/95 = 32.6% |
| 1 | DNA | 52 | 52/285 = 18.2% |
| Final | Amino Acids | 39 | 39/95 = 41% |
| Final | DNA | 66 | 66/285 = 23.2% |
| Both | Amino Acids | 44 | 44/95 = 46% |
| Both | DNA | 80 | 80/285 = 28.1% |
Table 3. The calculated percentage differences of amino acid and DNA residues for Progressor groups at the initial visits, final visits, and combined groups. The data suggests a trend towards increasing diversity over time, within the progressor group. Amino acid sequences also show less consensus than DNA sequences.
Non Trending Groups
| Visit | Type | Number of Differences | Percentage Different |
|---|---|---|---|
| 1 | Amino Acids | 36 | 36/95 = 37.9% |
| 1 | DNA | 67 | 67/285 = 23.5% |
| Final | Amino Acids | 38 | 38/95 = 40% |
| Final | DNA | 67 | 67/285 = 23.5% |
| Both | Amino Acids | 43 | 43/95 = 45.3% |
| Both | DNA | 79 | 79/ 285=27.7% |
Table 4. Showing the percent difference in the Protein Sequence and DNA Sequence for Subject 5,6,13 for the first visit, final visit, and all the visits.
Secondary Structure Prediction in V3 Fragment
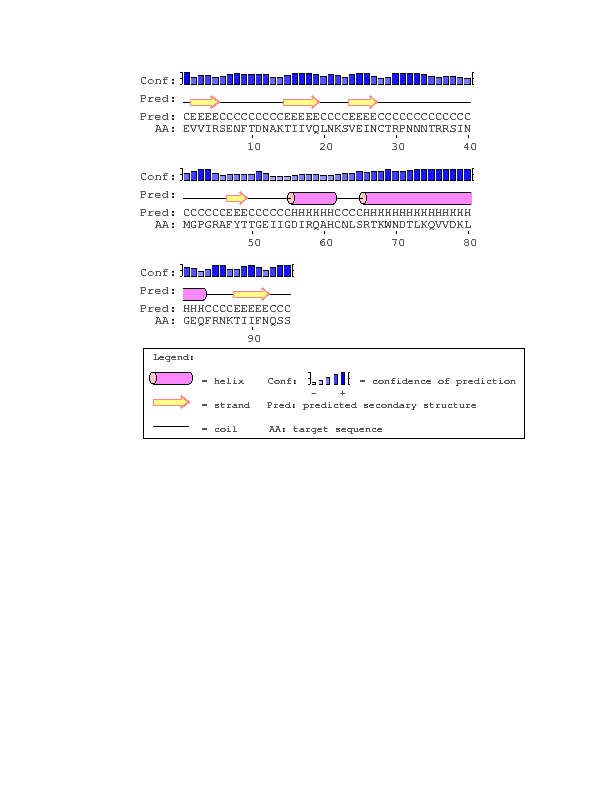
PSIPRED Protein Sequence Analysis Workbench was accessed. The multiple sequence alignments created through ClustalW were uploaded to the page for analysis for each group at the initial visit, final visit, and then for each subject. The following results were generated by the program. Yellow indicates beta sheets, pink cylinders indicate helices, and the black indicates the coil. The varying levels of confidence by the program is indicated by the height of size and darkness of the blue bar above each sequence.
AIDS Diagnosed


- With the exception of subject 15, each of the sequences matched the consensus sequence. Perhaps due to the influence of subject 15, the first and final visits results for all the sequences also are missing the beta sheet that subject 15 is missing.
AIDS Progressing


Non Trending


Analysis of V3 Structure
Huang et al. (2005) Structure 2B4C was uploaded onto StarBiochem. Images were developed by selecting various structural levels and adjusting size of atoms and groups. Using StarBiochem, the V3 region was isolated and the sequence was found.
Four polypeptide subunits were defined using the Quatenary structure methods:
- Chain G (Yellow)
- Residues: 84:G - 492:G
- Amino end: Valine (position 84)
- Carboxyl end: Glutamate (position 492)
- Chain C (Light Pink)
- Residues: 1:C - 175:C
- Amino end: Lysine (position 1)
- Carboxyl end: Valine (position 175)
- Chain L (Green)
- Residues: 1:L - 214:L
- Amino end: Glutamate (position 1)
- Carboxyl end: Cysteine (position 214)
- Chain H (Dark Red)
- Residues: 2:H - 216:H
- Amino end: Glutamine (position 2)
- Carboxyl end: Cysteine (position 216)


Secondary Structure Elements:
- Beta Sheets: 22
- Alpha Helices: 17
- Random Coil: 84

V3 Region
- Located between 296:G and 331:G
- Sequence as follows:
- C T R P N Q N T R K S I H I G P G R A F Y T T G E I I G D I R Q A H C
- V3 Amino Acid Properties
- Nonpolar: 12
- Polar: 11
- Positively charged: 6
- Negatively charged: 2
- Aromatic: 2


The gp120 protein from Huang et al. was ran on PSIpred in order to predict secondary structures. The V3 region sequence was identified at residues 293 through 326. This was compared to the PSIPred's for the Markham et al. sequences. The amino acid for the Markham et al. sequences were identified from residues 29-63. In each of the PSIPred runs, a corresponding beta sheet and alpha helix exists, as expected. This shows that the proper portion of the Markham et al. sequences were identified as the V3 regions.

Amino Acid Sequence Effects on V3
The amino acids of the Markham et al. sequences with non conserved residues within the V3 region (residues 29-63 of the 95 amino acid sequence) were analyzed for the progressing group
| Visit | Position (from start of V3 sequence) | Conservation | Residues |
|---|---|---|---|
| 1 | 10 | strongly conserved | K, R |
| 1 | 13 | no conservation | N, S, P, L |
| 1 | 14 | no conservation | T, I |
| 1 | 20 | strong | F |
| 1 | 22 | strong | A, T |
| 1 | 25 | strong | D, E |
| 1 | 29 | strong | D, N |
| 1 | 10 | no conservation | N, S, P, L |
| F | 5 | strong | N, H |
| F | 10 | strong | K, E |
| F | 11 | no conservation | R, S |
| F | 13 | no conservation | S, H, N |
| F | 14 | strong | L, I |
| F | 19 | weak | V, A |
| F | 20 | none | Y, F, L |
| F | 22 | strong | T, A |
| F | 25 | none | Q, E, K, A |
| F | 29 | strong | D, N |
| F | 32 | strong | K, Q |
| F | 34 | strong | Y, H |
| All | 5 | strong | N, H |
| All | 10 | weak | K, E |
| All | 11 | no conservation | R, S |
| All | 13 | no conservation | S, H, N, L, P |
| All | 14 | none | L, I |
| All | 19 | weak | V, A |
| All | 20 | none | Y, F, L |
| All | 22 | strong | T, A |
| All | 25 | none | Q, E, K, A, D |
| All | 29 | strong | D, N |
| All | 32 | strong | K, Q |
| All | 34 | strong | Y, H |
Table 5: Sequences analyzed for progress or group changes at the V3 region.
Presentation
Weekly Assignments
- Week 1 Assignment
- Week 2 Assignment
- Week 3 Assignment
- Week 4 Assignment
- Week 5 Assignment
- Week 6 Assignment
- Week 7 Assignment
- Week 8 Assignment
- Week 9 Assignment
- Week 10 Assignment
- Week 11 Assignment
- Week 12 Assignment
- Week 13 Assignment
- Week 15 Assignment
Class Journals
- Class Journal Week 1
- Class Journal Week 2
- Class Journal Week 3
- Class Journal Week 4
- Class Journal Week 5
- Class Journal Week 6
- Class Journal Week 7
- Class Journal Week 8
- Class Journal Week 9
- Class Journal Week 10
- Class Journal Week 11
- Class Journal Week 12
- Class Journal Week 13
- Class Journal Week 15